

Question: Construct a line chart to examine the Total Population growth (row 35 of the worksheet) for the years 2000-2009. Format the chart with the

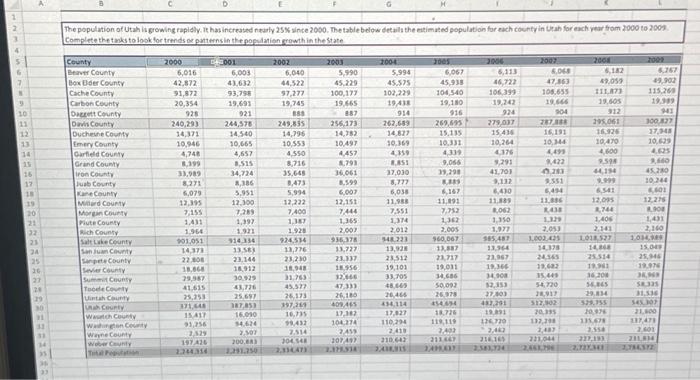
Construct a line chart to examine the "Total Population" growth (row 35 of the worksheet) for the years 2000-2009. Format the chart with the title "Total Utah Population" and a legend to the right of the chart. Use the dates in row 5 of the worksheet as the labels for the horizontal axis. Add a linear trendline to the "Total Utah Population" chart. (Notice how closely this follows the actual data.) Construct a line chart to compare the population growth for the years 2000-2009 in the following counties: Davis, Salt Lake, Utah, and Weber. Format the chart with the title "Population in Selected Counties" and a legend to the right of the chart. Use the dates in row 5 of the worksheet as the labels for the horizontal axis. 1 2 3 4 5 6 7 N 9 10 11 12 13 34 15 16 17 18 39 20 21 32 23 24 25 26 27 28 29 30 14 31 14 The population of Utah is growing rapidly. It has increased nearly 25% since 2000. The table below details the estimated population for each county in Utah for each year from 2000 to 2009 Complete the tasks to look for trends or patterns in the population growth in the State County Beaver County Box Elder County Cache County Carbon County Dagrett County Davis County Ducheune County Emery County Garfield County Grand County Iron County Juab County Kane County Millard County Morgan County Plute County Rich County Salt Lake County San Juan County Sanpete County Sevier County Summit County Toodle County Uintah County Utah County Wasetch County Washington County Wayne County Weber County Tital Population 2000 6,016 42,872 91,872 20,354 928 240,293 14,371 10,946 4,748 8,399 33,989 8,271 6,079 12,395 7,155 1,431 1,964 901,051 14,373 22,808 18.868 29,987 41,615 25,253 371,448 15,417 91,256 2,329 197,426 2.244.314 001 6,003 43,632 93,798 19,691 921 244,578 14,540 10,665 4,657 8,515 34,724 8,386 5,951 12,300 7.289 1,397 914.334 13.583 23,144 18,912 30,929 43,726 25,697 187,853 16.090 34,624 2,507 200,883 2.291.350 2002 6,040 44,522 97,277 19,745 888 249,855 14,796 10,553 4,550 8,716 35,648 8,473 5,994 12,222 7,400 1,387 1,928 924,534 13,776 23,230 18,948 31,763 45,577 26,173 397,269 10,735 99,432 2,514 304,548 2,33(47) 2003 5,990 45,229 100,177 19,665 887 256,173 14,782 10,497 4,457 8,793 36,061 8,599 6,007 12,151 7,444 1,365 2,007 936.378 13,727 23.337 18,956 32,666 47,333 26,180 409,465 17,382 104,274 2,459 207497 2.378.934 2004 5,994 45,575 102,229 19,438 914 262,689 14,827 10,369 4,359 8.851 37,030 LLL'S 6,038 11,988 7,551 1,374 2,012 548,223 13,928 23,512 19,101 33,705 48,665 26,466 434,114 17,827 110,294 2,419 210.642 2,416315 2005 6,067 45,938 104,540 19,180 916 269,695 15,135 10,331 4,339 990'6 39,298 8.385 6,167 11,891 7,752 1,362 2,005 960,067 13,887 23,717 19,031 34,686 50,092 26.978 454,694 18,726 119,119 tov't 211467 2A1AXY 900 6,113 46,722 106,399 19,242 924 279,037 15,416 10,264 4,376 9,291 41,701 9,132 6,430 11,889 8,062 1,350 1,977 965,487 13,364 23,967 19,366 34,908 12,353 27,803 432,291 19,891 126,720 216,165 2,383,324 2007 6,068 47,363 106.655 19,666 904 287,388 16,191 10,344 4,499 9,422 4,383 9,551 6,494 11,896 8,438 1.329 2,053 1,002,425 14,378 24,565 19,682 35,445 54,720 28,917 2008 6,182 49,059 111,873 19,605 912 295,061 16.926 10,470 4,600 9,598 44,194 9.999 6,541 12,095 8,744 1,406 2,141 1,018,527 14,864 25,514 19,961 36,200 56,865 29,834 512,902 529,755 20,395 20,976 132,298 135,678 2,487 221,044 2461796 2.727341 2.558 327,193 2009 6,767 49,902 115,269 19,999 943 300,827 17,948 10,629 4,625 3,660 45.280 10,244 4,601 12,276 8,908 1,431 2,140 1.034,99 15,049 25,946 19,976 ENCYC $8,335 31,536 545,307 21,400 137,473 2,601 211,814 2,784372 Construct a line chart to examine the "Total Population" growth (row 35 of the worksheet) for the years 2000-2009. Format the chart with the title "Total Utah Population" and a legend to the right of the chart. Use the dates in row 5 of the worksheet as the labels for the horizontal axis. Add a linear trendline to the "Total Utah Population" chart. (Notice how closely this follows the actual data.) Construct a line chart to compare the population growth for the years 2000-2009 in the following counties: Davis, Salt Lake, Utah, and Weber. Format the chart with the title "Population in Selected Counties" and a legend to the right of the chart. Use the dates in row 5 of the worksheet as the labels for the horizontal axis. 1 2 3 4 5 6 7 N 9 10 11 12 13 34 15 16 17 18 39 20 21 32 23 24 25 26 27 28 29 30 14 31 14 The population of Utah is growing rapidly. It has increased nearly 25% since 2000. The table below details the estimated population for each county in Utah for each year from 2000 to 2009 Complete the tasks to look for trends or patterns in the population growth in the State County Beaver County Box Elder County Cache County Carbon County Dagrett County Davis County Ducheune County Emery County Garfield County Grand County Iron County Juab County Kane County Millard County Morgan County Plute County Rich County Salt Lake County San Juan County Sanpete County Sevier County Summit County Toodle County Uintah County Utah County Wasetch County Washington County Wayne County Weber County Tital Population 2000 6,016 42,872 91,872 20,354 928 240,293 14,371 10,946 4,748 8,399 33,989 8,271 6,079 12,395 7,155 1,431 1,964 901,051 14,373 22,808 18.868 29,987 41,615 25,253 371,448 15,417 91,256 2,329 197,426 2.244.314 001 6,003 43,632 93,798 19,691 921 244,578 14,540 10,665 4,657 8,515 34,724 8,386 5,951 12,300 7.289 1,397 914.334 13.583 23,144 18,912 30,929 43,726 25,697 187,853 16.090 34,624 2,507 200,883 2.291.350 2002 6,040 44,522 97,277 19,745 888 249,855 14,796 10,553 4,550 8,716 35,648 8,473 5,994 12,222 7,400 1,387 1,928 924,534 13,776 23,230 18,948 31,763 45,577 26,173 397,269 10,735 99,432 2,514 304,548 2,33(47) 2003 5,990 45,229 100,177 19,665 887 256,173 14,782 10,497 4,457 8,793 36,061 8,599 6,007 12,151 7,444 1,365 2,007 936.378 13,727 23.337 18,956 32,666 47,333 26,180 409,465 17,382 104,274 2,459 207497 2.378.934 2004 5,994 45,575 102,229 19,438 914 262,689 14,827 10,369 4,359 8.851 37,030 LLL'S 6,038 11,988 7,551 1,374 2,012 548,223 13,928 23,512 19,101 33,705 48,665 26,466 434,114 17,827 110,294 2,419 210.642 2,416315 2005 6,067 45,938 104,540 19,180 916 269,695 15,135 10,331 4,339 990'6 39,298 8.385 6,167 11,891 7,752 1,362 2,005 960,067 13,887 23,717 19,031 34,686 50,092 26.978 454,694 18,726 119,119 tov't 211467 2A1AXY 900 6,113 46,722 106,399 19,242 924 279,037 15,416 10,264 4,376 9,291 41,701 9,132 6,430 11,889 8,062 1,350 1,977 965,487 13,364 23,967 19,366 34,908 12,353 27,803 432,291 19,891 126,720 216,165 2,383,324 2007 6,068 47,363 106.655 19,666 904 287,388 16,191 10,344 4,499 9,422 4,383 9,551 6,494 11,896 8,438 1.329 2,053 1,002,425 14,378 24,565 19,682 35,445 54,720 28,917 2008 6,182 49,059 111,873 19,605 912 295,061 16.926 10,470 4,600 9,598 44,194 9.999 6,541 12,095 8,744 1,406 2,141 1,018,527 14,864 25,514 19,961 36,200 56,865 29,834 512,902 529,755 20,395 20,976 132,298 135,678 2,487 221,044 2461796 2.727341 2.558 327,193 2009 6,767 49,902 115,269 19,999 943 300,827 17,948 10,629 4,625 3,660 45.280 10,244 4,601 12,276 8,908 1,431 2,140 1.034,99 15,049 25,946 19,976 ENCYC $8,335 31,536 545,307 21,400 137,473 2,601 211,814 2,784372
Step by Step Solution
3.48 Rating (155 Votes )
There are 3 Steps involved in it
Q1 Construct a line chart to examine the Total Population growth row 35 of ... View full answer

Get step-by-step solutions from verified subject matter experts