Answered step by step
Verified Expert Solution
Question
1 Approved Answer
1 2 3 Year 1 Year 2 Year 1 Year 2 Year 1 Revenue 5674 6676 176896 264167 179083 144249 Year 2 141198 113733 COGS
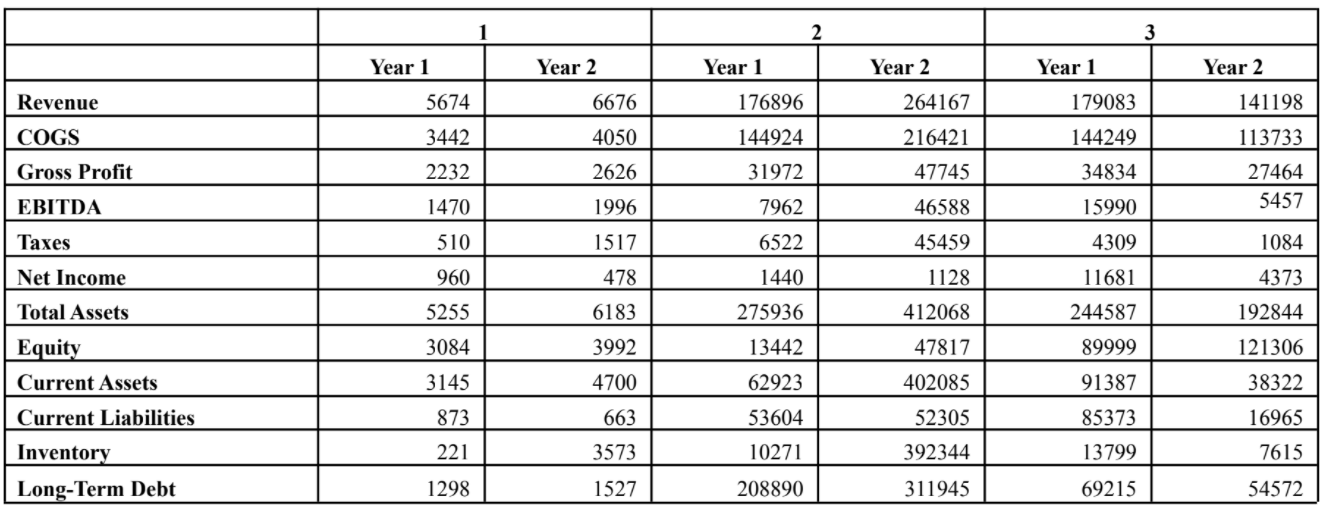
1 2 3 Year 1 Year 2 Year 1 Year 2 Year 1 Revenue 5674 6676 176896 264167 179083 144249 Year 2 141198 113733 COGS 3442 4050 144924 216421 2232 2626 31972 47745 34834 Gross Profit EBITDA 27464 5457 1470 1996 7962 46588 15990 Taxes 510 1517 6522 45459 4309 1084 960 478 1440 1128 11681 4373 5255 6183 275936 412068 244587 192844 Net Income Total Assets Equity Current Assets Current Liabilities 3084 3992 13442 47817 89999 121306 3145 4700 62923 53604 402085 52305 91387 85373 873 663 38322 16965 7615 Inventory 221 3573 10271 392344 13799 Long-Term Debt 1298 1527 208890 311945 69215 54572 5. Which company has the biggest current threat of being illiquid (lowest current ratio) in Year 2? 6. Which company saw the biggest increase in its net profit margin from Year 1 to Year 2 (or smallest decrease if NI all negative)? 7. What is company 3's ROA in Year 2? (ROA is represented as percentage) 8. What is company l's ROA in Year 1? (ROA is represented as percentage)
Step by Step Solution
There are 3 Steps involved in it
Step: 1
Get Instant Access to Expert-Tailored Solutions
See step-by-step solutions with expert insights and AI powered tools for academic success
Step: 2
Step: 3
Ace Your Homework with AI
Get the answers you need in no time with our AI-driven, step-by-step assistance
Get Started