

Question
1. 2. Estimate the value of a share of Cisco common stock using the discounted cash flow (DCF) model as of 31 July 2021, assuming
1. 
2. Estimate the value of a share of Cisco common stock using the discounted cash flow (DCF) model as of 31 July 2021, assuming a discount rate (WACC) of 7.6%. (Note: common shares outstanding is disclosed in the Consolidated Statements of Equity.)
3. Cisco stock closed at $58.60 on 9 September 2021, the date the Form 10-K was filed with the SEC. How does your valuation estimate compare with this closing price? What do you believe are some reasons for the difference? What investment decision is suggested from your results? (Maximum words: 100)
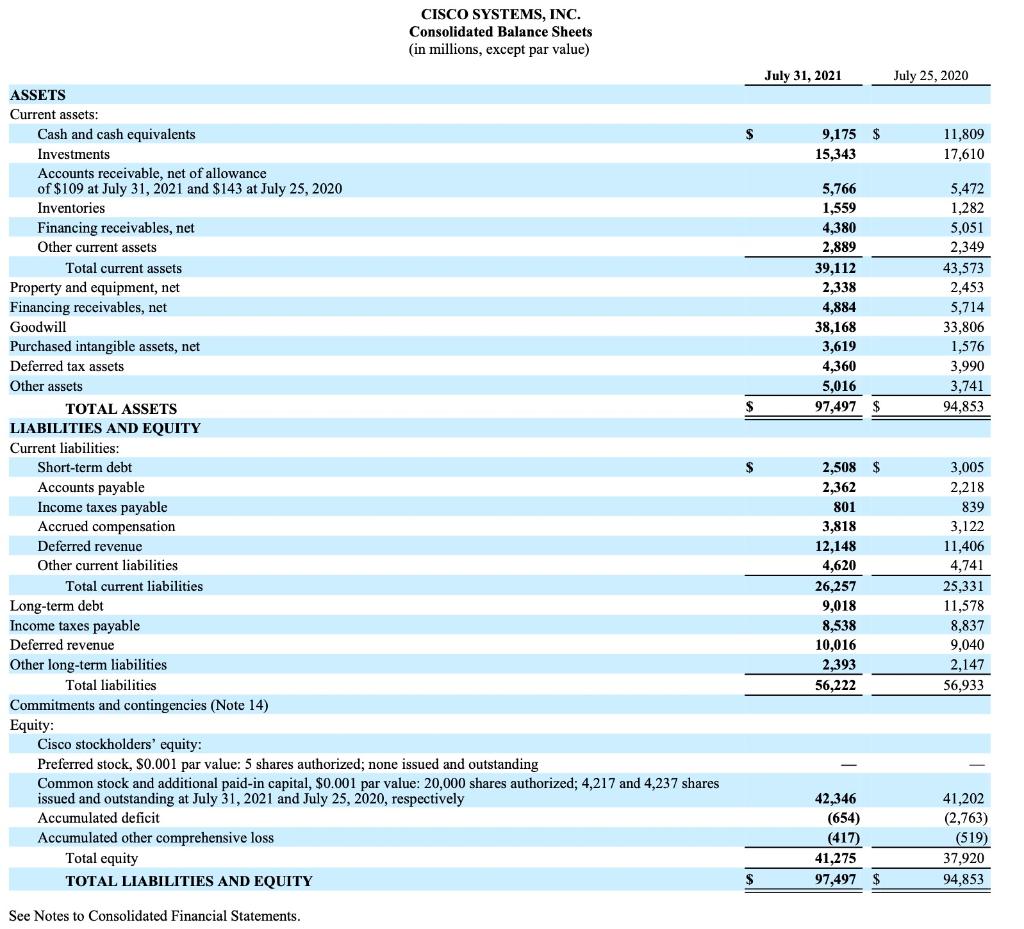
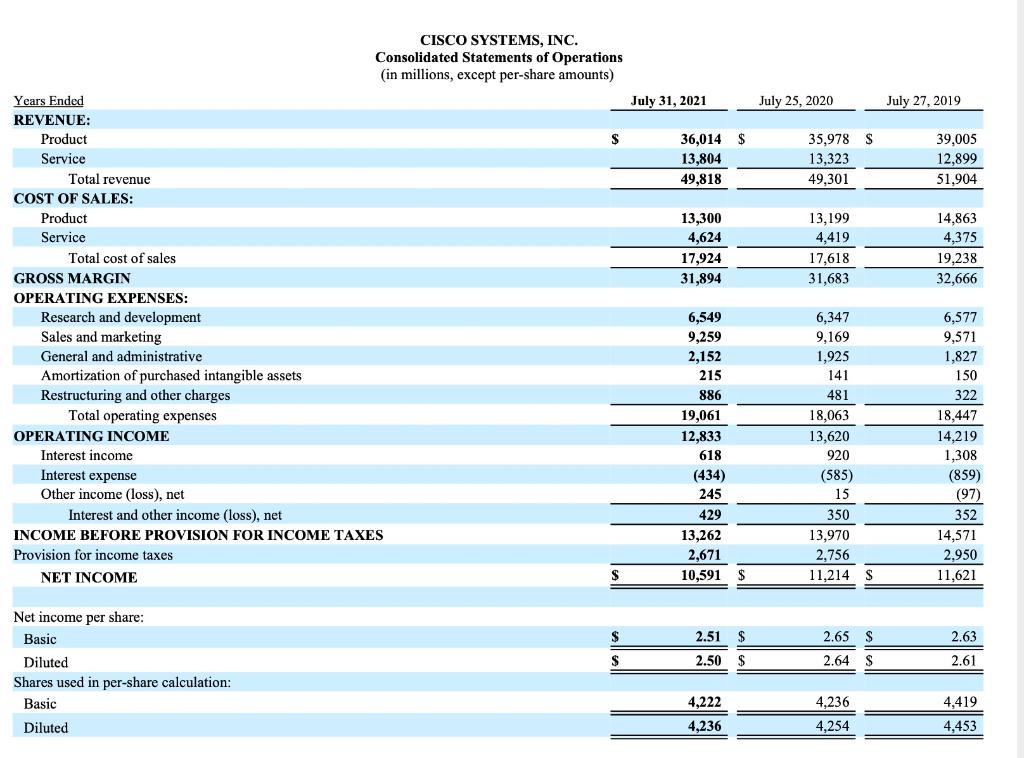
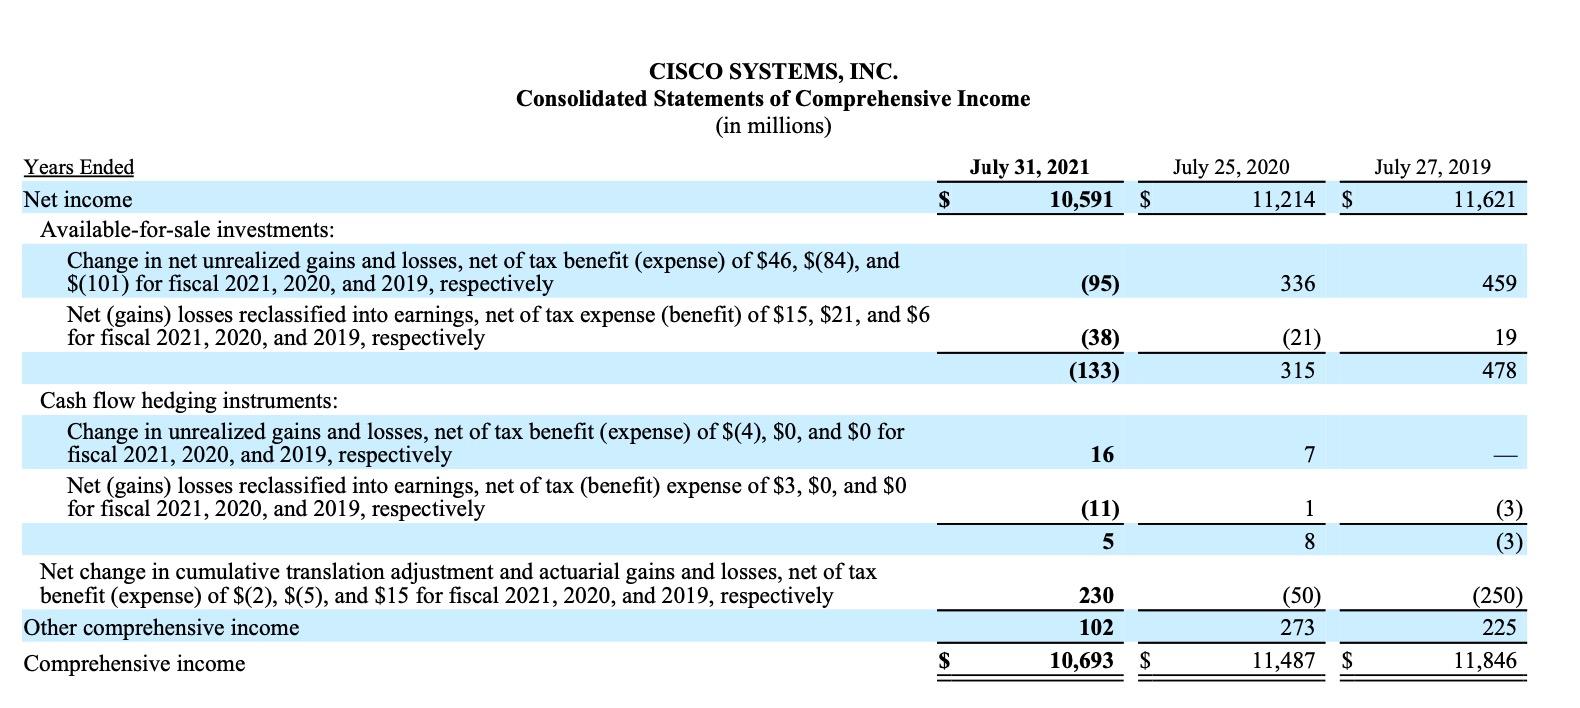
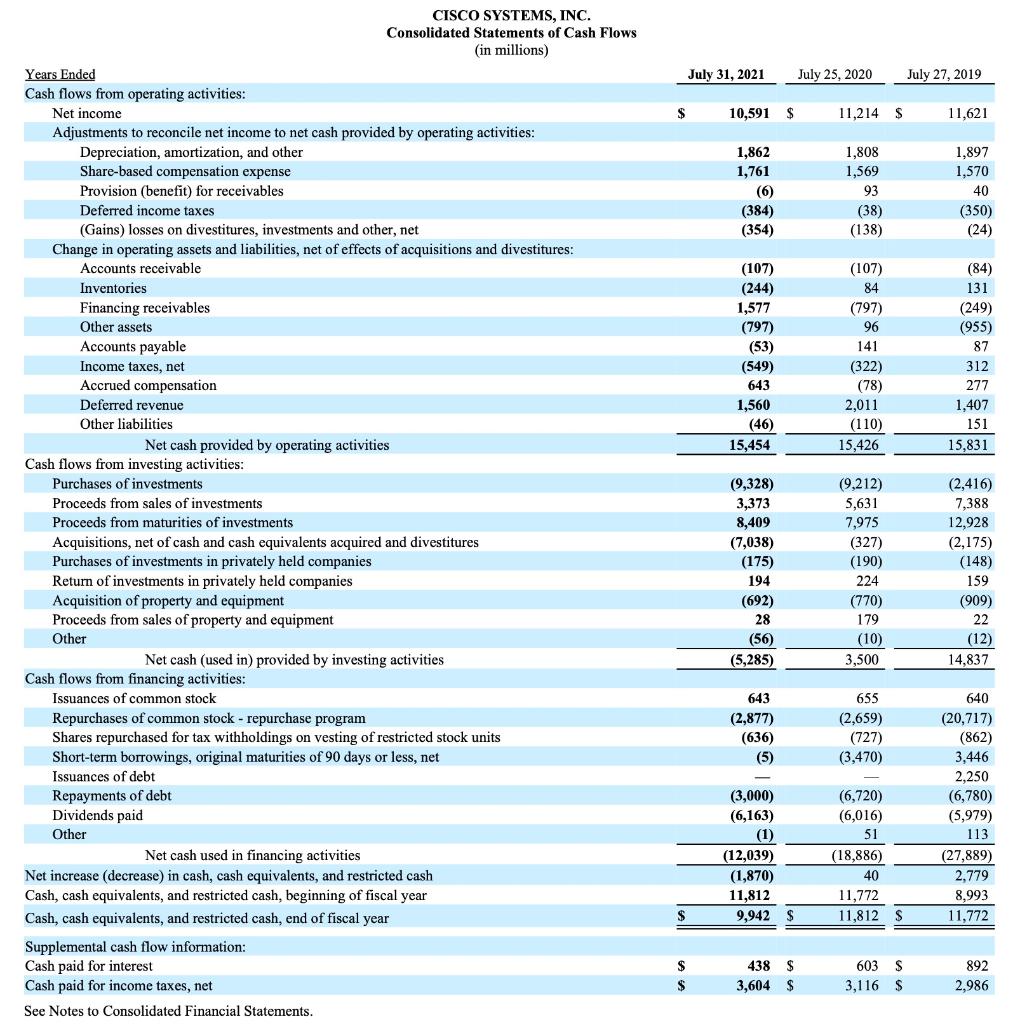
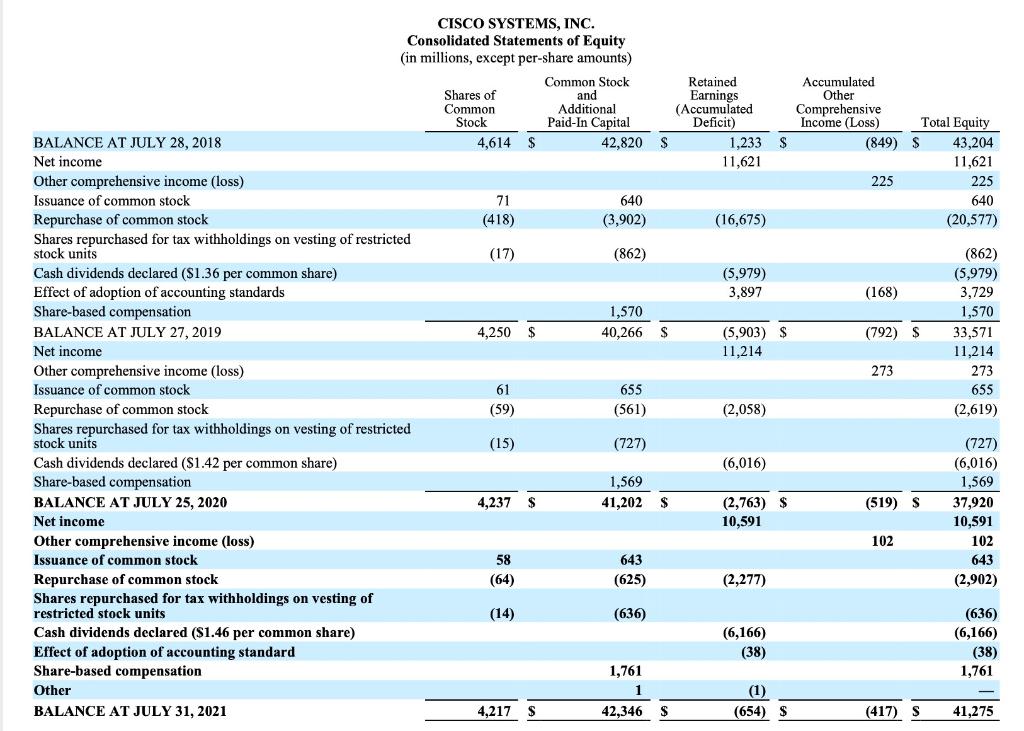
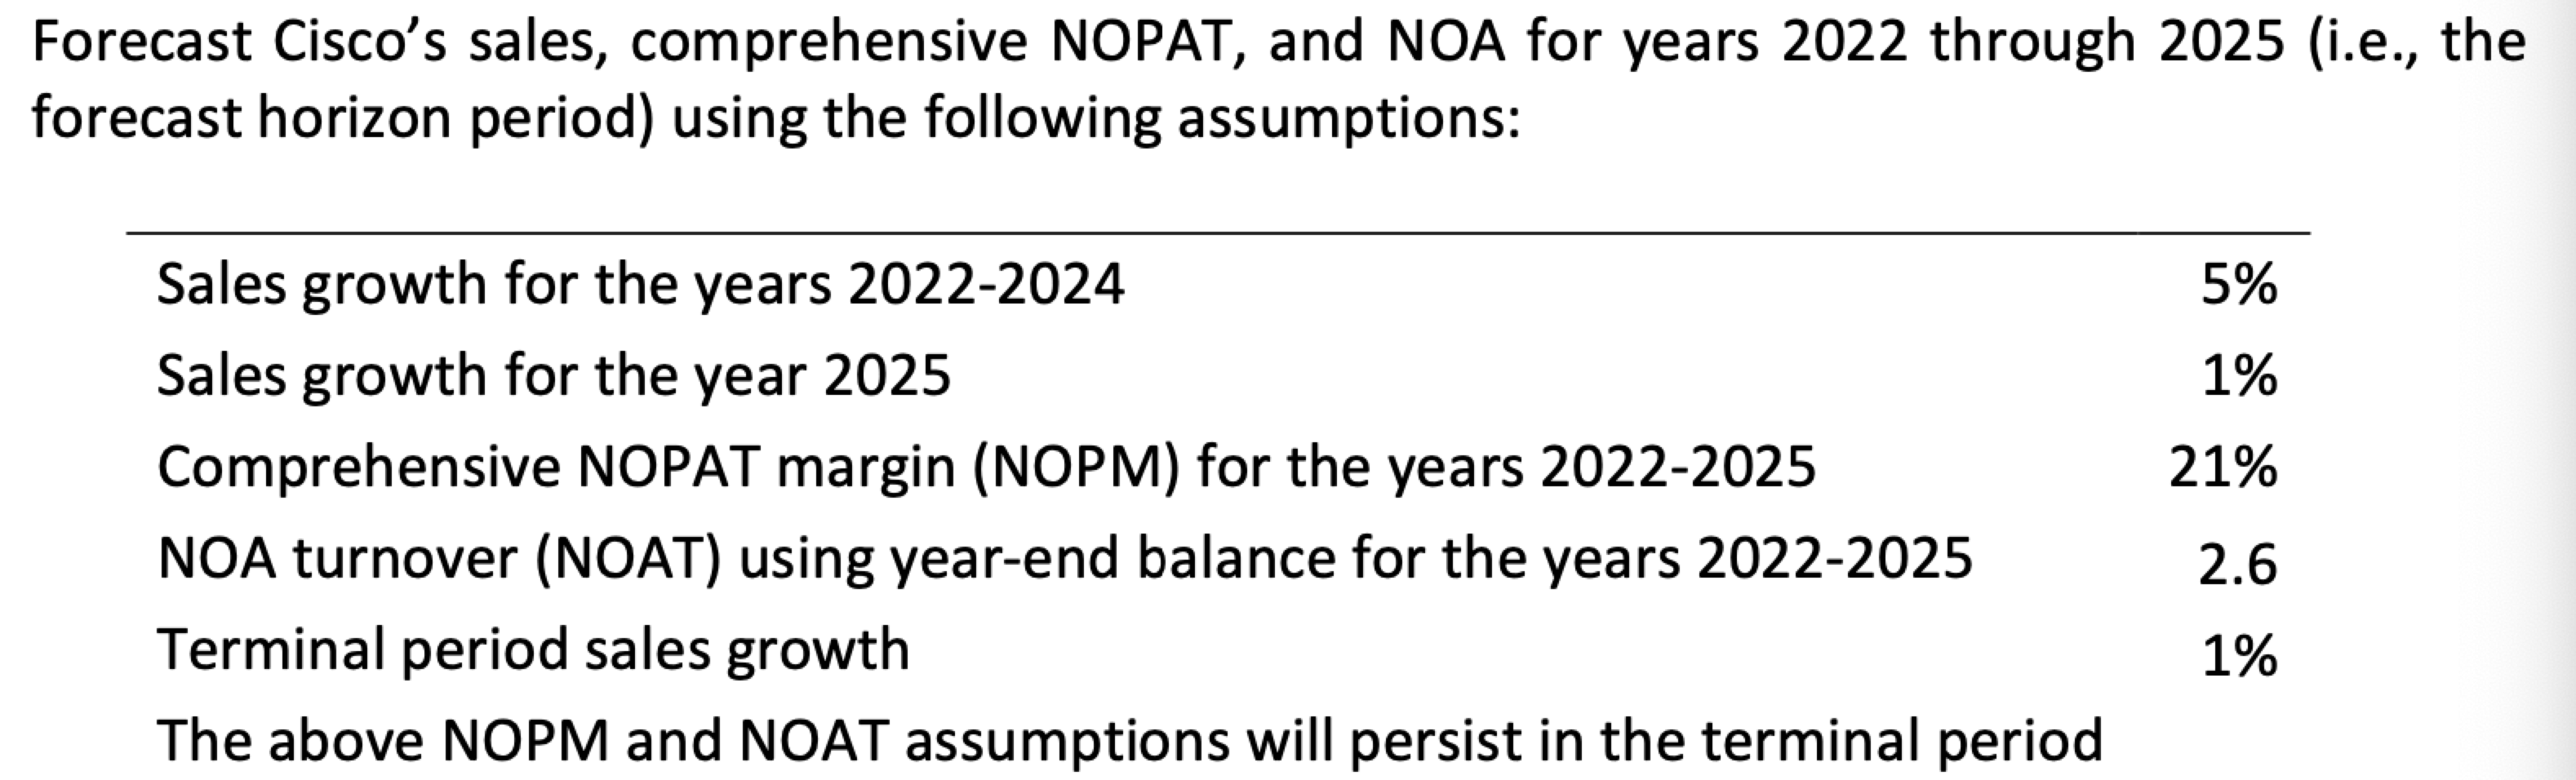
CISCO SYSTEMS, INC. Consolidated Balance Sheets (in millions, except par value) July 31, 2021 July 25, 2020 9,175 $ 15,343 11,809 17,610 5,766 1,559 4,380 2,889 39,112 2,338 4,884 38,168 3,619 4,360 5,016 97,497 5,472 1,282 5,051 2,349 43,573 2,453 5,714 33,806 1,576 3,990 3,741 94,853 $ $ ASSETS Current assets: Cash and cash equivalents Investments Accounts receivable, net of allowance of $109 at July 31, 2021 and $143 at July 25, 2020 Inventories Financing receivables, net Other current assets Total current assets Property and equipment, net Financing receivables, net Goodwill Purchased intangible assets, net Deferred tax assets Other assets TOTAL ASSETS LIABILITIES AND EQUITY Current liabilities: Short-term debt Accounts payable Income taxes payable Accrued compensation Deferred revenue Other current liabilities Total current liabilities Long-term debt Income taxes payable Deferred revenue Other long-term liabilities Total liabilities Commitments and contingencies (Note 14) Equity: Cisco stockholders' equity: Preferred stock, S0.001 par value: 5 shares authorized; none issued and outstanding Common stock and additional paid-in capital, $0.001 par value: 20,000 shares authorized; 4,217 and 4,237 shares issued and outstanding at July 31, 2021 and July 25, 2020, respectively Accumulated deficit Accumulated other comprehensive loss Total equity TOTAL LIABILITIES AND EQUITY 2,508 2,362 801 3,818 12,148 4,620 26,257 9,018 8,538 10,016 2.393 56,222 3,005 2,218 839 3,122 11,406 4,741 25,331 11,578 8,837 9,040 2,147 56,933 42,346 (654) (417) 41,275 97,497 $ 41,202 (2,763) (519) 37,920 94,853 See Notes to Consolidated Financial Statements. July 25, 2020 July 27, 2019 $ 35,978 $ 13,323 49,301 39,005 12,899 51,904 13,199 4.419 17,618 31,683 14,863 4,375 19,238 32,666 CISCO SYSTEMS, INC. Consolidated Statements of Operations (in millions, except per-share amounts) Years Ended July 31, 2021 REVENUE: Product S 36,014 Service 13,804 Total revenue 49,818 COST OF SALES: Product 13,300 Service 4,624 Total cost of sales 17,924 GROSS MARGIN 31,894 OPERATING EXPENSES: Research and development 6,549 Sales and marketing 9,259 General and administrative 2,152 Amortization of purchased intangible assets 215 Restructuring and other charges 886 Total operating expenses 19,061 OPERATING INCOME 12,833 Interest income 618 Interest expense (434) Other income (loss), net 245 Interest and other income (loss), net 429 INCOME BEFORE PROVISION FOR INCOME TAXES 13,262 Provision for income taxes 2,671 NET INCOME S 10,591 6,347 9,169 1,925 141 481 18,063 13,620 920 6,577 9,571 1,827 150 322 18,447 14,219 1,308 (859) (97) 352 14,571 2,950 11,621 (585) 15 350 13,970 2.756 11,214 $ S $ 2.51 2.65 2.63 Net income per share: Basic Diluted Shares used in per-share calculation: Basic $ 2.50 2.64 $ 2.61 4,222 4,236 4,254 4,419 4,453 Diluted 4,236 July 25, 2020 11,214 $ July 27, 2019 11,621 336 459 CISCO SYSTEMS, INC. Consolidated Statements of Comprehensive Income (in millions) Years Ended July 31, 2021 Net income $ 10,591 $ Available-for-sale investments: Change in net unrealized gains and losses, net of tax benefit (expense) of $46, $(84), and $(101) for fiscal 2021, 2020, and 2019, respectively (95) Net (gains) losses reclassified into earnings, net of tax expense (benefit) of $15, $21, and $6 for fiscal 2021, 2020, and 2019, respectively (38) (133) Cash flow hedging instruments: Change in unrealized gains and losses, net of tax benefit (expense) of $(4), $0, and $0 for fiscal 2021, 2020, and 2019, respectively 16 Net (gains) losses reclassified into earnings, net of tax (benefit) expense of $3, $0, and $0 for fiscal 2021, 2020, and 2019, respectively (11) 5 Net change in cumulative translation adjustment and actuarial gains and losses, net of tax benefit (expense) of $(2), $(5), and $15 for fiscal 2021, 2020, and 2019, respectively 230 Other comprehensive income 102 Comprehensive income $ 10,693 $ (21) 315 19 478 7 1 (3) (3) 8 (50) 273 11,487 $ (250) 225 11,846 July 31, 2021 July 25, 2020 July 27, 2019 $ 10,591 $ 11,214 $ 11,621 1,862 1,761 (6) (384) (354) 1,808 1,569 93 (38) (138) 1,897 1,570 40 (350) (24) TITLE (107) (244) 1,577 (797) (53) (549) 643 1,560 (46) 15,454 (107) 84 (797) 96 141 (322) (78) 2,011 (110) 15,426 (84) 131 (249) (955) 87 312 277 1,407 151 15,831 CISCO SYSTEMS, INC. Consolidated Statements of Cash Flows (in millions) Years Ended Cash flows from operating activities: Net income Adjustments to reconcile net income to net cash provided by operating activities: Depreciation, amortization, and other Share-based compensation expense Provision (benefit) for receivables Deferred income taxes (Gains) losses on divestitures, investments and other, net Change in operating assets and liabilities, net of effects of acquisitions and divestitures: Accounts receivable Inventories Financing receivables Other assets Accounts payable Income taxes, net Accrued compensation Deferred revenue Other liabilities Net cash provided by operating activities Cash flows from investing activities: Purchases of investments Proceeds from sales of investments Proceeds from maturities of investments Acquisitions, net of cash and cash equivalents acquired and divestitures Purchases of investments in privately held companies Return of investments in privately held companies Acquisition of property and equipment Proceeds from sales of property and equipment Other Net cash (used in) provided by investing activities Cash flows from financing activities: Issuances of common stock Repurchases of common stock - repurchase program Shares repurchased for tax withholdings on vesting of restricted stock units Short-term borrowings, original maturities of 90 days or less, net Issuances of debt Repayments of debt Dividends paid Other Net cash used in financing activities Net increase (decrease) in cash, cash equivalents, and restricted Cash, cash equivalents, and restricted cash, beginning of fiscal year Cash, cash equivalents, and restricted cash, end of fiscal year Supplemental cash flow information: Cash paid for interest Cash paid for income taxes, net See Notes to Consolidated Financial Statements. (9,328) 3,373 8,409 (7,038) (175) 194 (692) 28 (56) (5,285) (9,212) 5,631 7,975 (327) (190) 224 (770) 179 (10) 3,500 (2,416) 7,388 12,928 (2,175) (148) 159 (909) 22 (12) 14,837 643 (2,877) (636) (5) 655 (2,659) (727) (3,470) (3,000) (6,163) (1) (12,039) (1,870) 11,812 9,942 (6,720) (6,016) 51 (18,886) 40 11,772 11,812 640 (20,717) (862) 3,446 2,250 (6,780) (5,979) 113 (27,889) 2,779 8,993 11.772 $ $ S $ 438 $ 3,604 $ 603 3,116 $ 892 2.986 $ Accumulated Other Comprehensive Income (Loss) Total Equity (849) $ 43,204 11,621 225 225 640 (20,577) (168) (792) $ CISCO SYSTEMS, INC. Consolidated Statements of Equity (in millions, except per-share amounts) Common Stock Retained Shares of and Earnings Common Additional (Accumulated Stock Paid-In Capital Deficit) BALANCE AT JULY 28, 2018 4,614 $ 42,820 S 1,233 S Net income 11,621 Other comprehensive income (loss) Issuance of common stock 71 640 Repurchase of common stock (418) (3,902) (16,675) Shares repurchased for tax withholdings on vesting of restricted stock units (17) (862) Cash dividends declared ($1.36 per common share) (5,979) Effect of adoption of accounting standards 3,897 Share-based compensation 1,570 BALANCE AT JULY 27, 2019 4,250 40,266 $ (5,903) $ Net income 11,214 Other comprehensive income (loss) Issuance of common stock 61 655 Repurchase of common stock (59) (561) (2,058) Shares repurchased for tax withholdings on vesting of restricted stock units (15) (727) Cash dividends declared ($1.42 per common share) (6,016) Share-based compensation 1,569 BALANCE AT JULY 25, 2020 4,237 $ 41,202 $ (2,763) $ Net income 10,591 Other comprehensive income (loss) Issuance of common stock 58 643 Repurchase of common stock (64) (2,277) Shares repurchased for tax withholdings on vesting of restricted stock units (14) (636) Cash dividends declared ($1.46 per common share) (6,166) Effect of adoption of accounting standard (38) Share-based compensation 1,761 Other 1 (1) BALANCE AT JULY 31, 2021 4,217 42,346 $ (654) $ (862) (5,979) 3,729 1,570 33,571 11,214 273 655 (2,619) 273 (519) S (727) (6,016) 1,569 37,920 10,591 102 643 (2,902) 102 (625) (636) (6,166) (38) 1,761 4,217 (417) S 41,275 Forecast Cisco's sales, comprehensive NOPAT, and NOA for years 2022 through 2025 (i.e., the forecast horizon period) using the following assumptions: 5% 1% 21% Sales growth for the years 2022-2024 Sales growth for the year 2025 Comprehensive NOPAT margin (NOPM) for the years 2022-2025 NOA turnover (NOAT) using year-end balance for the years 2022-2025 Terminal period sales growth The above NOPM and NOAT assumptions will persist in the terminal period 2.6 1% CISCO SYSTEMS, INC. Consolidated Balance Sheets (in millions, except par value) July 31, 2021 July 25, 2020 9,175 $ 15,343 11,809 17,610 5,766 1,559 4,380 2,889 39,112 2,338 4,884 38,168 3,619 4,360 5,016 97,497 5,472 1,282 5,051 2,349 43,573 2,453 5,714 33,806 1,576 3,990 3,741 94,853 $ $ ASSETS Current assets: Cash and cash equivalents Investments Accounts receivable, net of allowance of $109 at July 31, 2021 and $143 at July 25, 2020 Inventories Financing receivables, net Other current assets Total current assets Property and equipment, net Financing receivables, net Goodwill Purchased intangible assets, net Deferred tax assets Other assets TOTAL ASSETS LIABILITIES AND EQUITY Current liabilities: Short-term debt Accounts payable Income taxes payable Accrued compensation Deferred revenue Other current liabilities Total current liabilities Long-term debt Income taxes payable Deferred revenue Other long-term liabilities Total liabilities Commitments and contingencies (Note 14) Equity: Cisco stockholders' equity: Preferred stock, S0.001 par value: 5 shares authorized; none issued and outstanding Common stock and additional paid-in capital, $0.001 par value: 20,000 shares authorized; 4,217 and 4,237 shares issued and outstanding at July 31, 2021 and July 25, 2020, respectively Accumulated deficit Accumulated other comprehensive loss Total equity TOTAL LIABILITIES AND EQUITY 2,508 2,362 801 3,818 12,148 4,620 26,257 9,018 8,538 10,016 2.393 56,222 3,005 2,218 839 3,122 11,406 4,741 25,331 11,578 8,837 9,040 2,147 56,933 42,346 (654) (417) 41,275 97,497 $ 41,202 (2,763) (519) 37,920 94,853 See Notes to Consolidated Financial Statements. July 25, 2020 July 27, 2019 $ 35,978 $ 13,323 49,301 39,005 12,899 51,904 13,199 4.419 17,618 31,683 14,863 4,375 19,238 32,666 CISCO SYSTEMS, INC. Consolidated Statements of Operations (in millions, except per-share amounts) Years Ended July 31, 2021 REVENUE: Product S 36,014 Service 13,804 Total revenue 49,818 COST OF SALES: Product 13,300 Service 4,624 Total cost of sales 17,924 GROSS MARGIN 31,894 OPERATING EXPENSES: Research and development 6,549 Sales and marketing 9,259 General and administrative 2,152 Amortization of purchased intangible assets 215 Restructuring and other charges 886 Total operating expenses 19,061 OPERATING INCOME 12,833 Interest income 618 Interest expense (434) Other income (loss), net 245 Interest and other income (loss), net 429 INCOME BEFORE PROVISION FOR INCOME TAXES 13,262 Provision for income taxes 2,671 NET INCOME S 10,591 6,347 9,169 1,925 141 481 18,063 13,620 920 6,577 9,571 1,827 150 322 18,447 14,219 1,308 (859) (97) 352 14,571 2,950 11,621 (585) 15 350 13,970 2.756 11,214 $ S $ 2.51 2.65 2.63 Net income per share: Basic Diluted Shares used in per-share calculation: Basic $ 2.50 2.64 $ 2.61 4,222 4,236 4,254 4,419 4,453 Diluted 4,236 July 25, 2020 11,214 $ July 27, 2019 11,621 336 459 CISCO SYSTEMS, INC. Consolidated Statements of Comprehensive Income (in millions) Years Ended July 31, 2021 Net income $ 10,591 $ Available-for-sale investments: Change in net unrealized gains and losses, net of tax benefit (expense) of $46, $(84), and $(101) for fiscal 2021, 2020, and 2019, respectively (95) Net (gains) losses reclassified into earnings, net of tax expense (benefit) of $15, $21, and $6 for fiscal 2021, 2020, and 2019, respectively (38) (133) Cash flow hedging instruments: Change in unrealized gains and losses, net of tax benefit (expense) of $(4), $0, and $0 for fiscal 2021, 2020, and 2019, respectively 16 Net (gains) losses reclassified into earnings, net of tax (benefit) expense of $3, $0, and $0 for fiscal 2021, 2020, and 2019, respectively (11) 5 Net change in cumulative translation adjustment and actuarial gains and losses, net of tax benefit (expense) of $(2), $(5), and $15 for fiscal 2021, 2020, and 2019, respectively 230 Other comprehensive income 102 Comprehensive income $ 10,693 $ (21) 315 19 478 7 1 (3) (3) 8 (50) 273 11,487 $ (250) 225 11,846 July 31, 2021 July 25, 2020 July 27, 2019 $ 10,591 $ 11,214 $ 11,621 1,862 1,761 (6) (384) (354) 1,808 1,569 93 (38) (138) 1,897 1,570 40 (350) (24) TITLE (107) (244) 1,577 (797) (53) (549) 643 1,560 (46) 15,454 (107) 84 (797) 96 141 (322) (78) 2,011 (110) 15,426 (84) 131 (249) (955) 87 312 277 1,407 151 15,831 CISCO SYSTEMS, INC. Consolidated Statements of Cash Flows (in millions) Years Ended Cash flows from operating activities: Net income Adjustments to reconcile net income to net cash provided by operating activities: Depreciation, amortization, and other Share-based compensation expense Provision (benefit) for receivables Deferred income taxes (Gains) losses on divestitures, investments and other, net Change in operating assets and liabilities, net of effects of acquisitions and divestitures: Accounts receivable Inventories Financing receivables Other assets Accounts payable Income taxes, net Accrued compensation Deferred revenue Other liabilities Net cash provided by operating activities Cash flows from investing activities: Purchases of investments Proceeds from sales of investments Proceeds from maturities of investments Acquisitions, net of cash and cash equivalents acquired and divestitures Purchases of investments in privately held companies Return of investments in privately held companies Acquisition of property and equipment Proceeds from sales of property and equipment Other Net cash (used in) provided by investing activities Cash flows from financing activities: Issuances of common stock Repurchases of common stock - repurchase program Shares repurchased for tax withholdings on vesting of restricted stock units Short-term borrowings, original maturities of 90 days or less, net Issuances of debt Repayments of debt Dividends paid Other Net cash used in financing activities Net increase (decrease) in cash, cash equivalents, and restricted Cash, cash equivalents, and restricted cash, beginning of fiscal year Cash, cash equivalents, and restricted cash, end of fiscal year Supplemental cash flow information: Cash paid for interest Cash paid for income taxes, net See Notes to Consolidated Financial Statements. (9,328) 3,373 8,409 (7,038) (175) 194 (692) 28 (56) (5,285) (9,212) 5,631 7,975 (327) (190) 224 (770) 179 (10) 3,500 (2,416) 7,388 12,928 (2,175) (148) 159 (909) 22 (12) 14,837 643 (2,877) (636) (5) 655 (2,659) (727) (3,470) (3,000) (6,163) (1) (12,039) (1,870) 11,812 9,942 (6,720) (6,016) 51 (18,886) 40 11,772 11,812 640 (20,717) (862) 3,446 2,250 (6,780) (5,979) 113 (27,889) 2,779 8,993 11.772 $ $ S $ 438 $ 3,604 $ 603 3,116 $ 892 2.986 $ Accumulated Other Comprehensive Income (Loss) Total Equity (849) $ 43,204 11,621 225 225 640 (20,577) (168) (792) $ CISCO SYSTEMS, INC. Consolidated Statements of Equity (in millions, except per-share amounts) Common Stock Retained Shares of and Earnings Common Additional (Accumulated Stock Paid-In Capital Deficit) BALANCE AT JULY 28, 2018 4,614 $ 42,820 S 1,233 S Net income 11,621 Other comprehensive income (loss) Issuance of common stock 71 640 Repurchase of common stock (418) (3,902) (16,675) Shares repurchased for tax withholdings on vesting of restricted stock units (17) (862) Cash dividends declared ($1.36 per common share) (5,979) Effect of adoption of accounting standards 3,897 Share-based compensation 1,570 BALANCE AT JULY 27, 2019 4,250 40,266 $ (5,903) $ Net income 11,214 Other comprehensive income (loss) Issuance of common stock 61 655 Repurchase of common stock (59) (561) (2,058) Shares repurchased for tax withholdings on vesting of restricted stock units (15) (727) Cash dividends declared ($1.42 per common share) (6,016) Share-based compensation 1,569 BALANCE AT JULY 25, 2020 4,237 $ 41,202 $ (2,763) $ Net income 10,591 Other comprehensive income (loss) Issuance of common stock 58 643 Repurchase of common stock (64) (2,277) Shares repurchased for tax withholdings on vesting of restricted stock units (14) (636) Cash dividends declared ($1.46 per common share) (6,166) Effect of adoption of accounting standard (38) Share-based compensation 1,761 Other 1 (1) BALANCE AT JULY 31, 2021 4,217 42,346 $ (654) $ (862) (5,979) 3,729 1,570 33,571 11,214 273 655 (2,619) 273 (519) S (727) (6,016) 1,569 37,920 10,591 102 643 (2,902) 102 (625) (636) (6,166) (38) 1,761 4,217 (417) S 41,275 Forecast Cisco's sales, comprehensive NOPAT, and NOA for years 2022 through 2025 (i.e., the forecast horizon period) using the following assumptions: 5% 1% 21% Sales growth for the years 2022-2024 Sales growth for the year 2025 Comprehensive NOPAT margin (NOPM) for the years 2022-2025 NOA turnover (NOAT) using year-end balance for the years 2022-2025 Terminal period sales growth The above NOPM and NOAT assumptions will persist in the terminal period 2.6 1%Step by Step Solution
There are 3 Steps involved in it
Step: 1

Get Instant Access to Expert-Tailored Solutions
See step-by-step solutions with expert insights and AI powered tools for academic success
Step: 2

Step: 3
Ace Your Homework with AI
Get the answers you need in no time with our AI-driven, step-by-step assistance
Get Started
Balancing Acts Unleashing The Power Of Creativity In Your Life And Work
Authors: Daniel Lamarre
1st Edition
1400223024, 978-1400223022