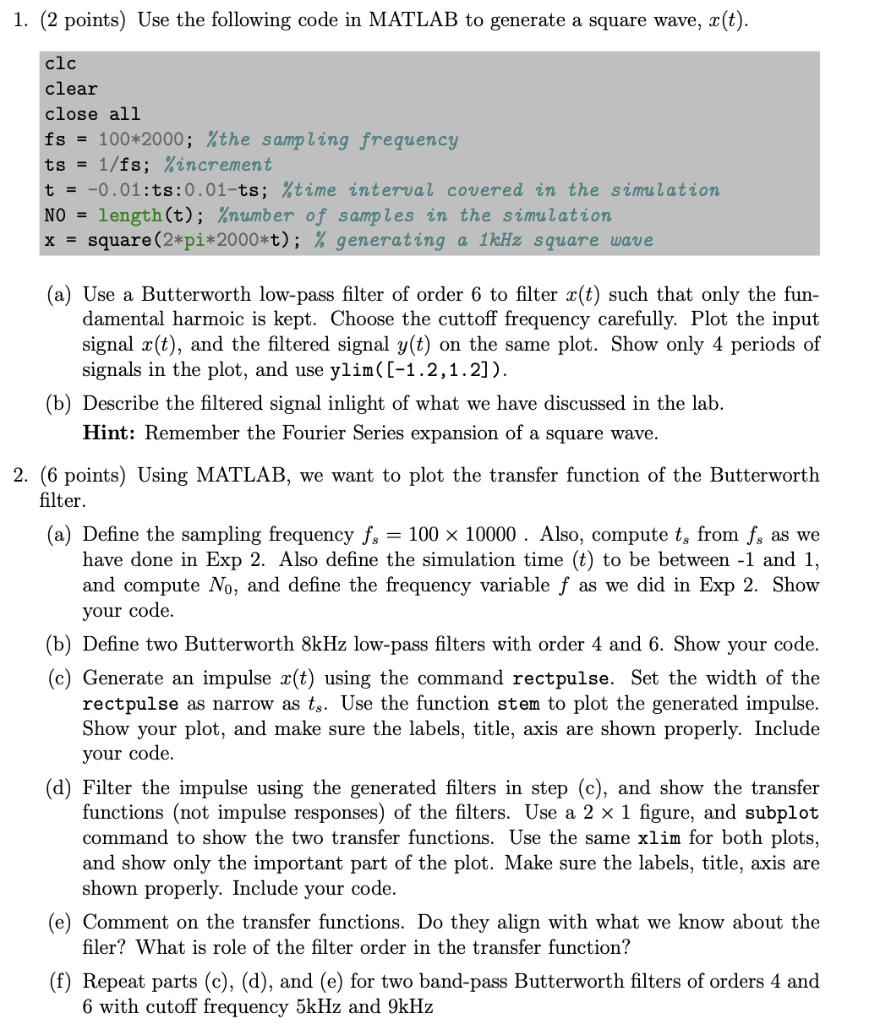
1. (2 points) Use the following code in MATLAB to generate a square wave, x(t). clc clear close all fs = 100*2000; %the sampling frequency ts = 1/fs; %increment t = -0.01:ts:0.01-ts; %time interval covered in the simulation NO = length(t); %number of samples in the simulation x = square (2*pi*2000*t); % generating a 1kHz square wave (a) Use a Butterworth low-pass filter of order 6 to filter x(t) such that only the fun- damental harmoic is kept. Choose the cuttoff frequency carefully. Plot the input signal x(t), and the filtered signal y(t) on the same plot. Show only 4 periods of signals in the plot, and use ylim([-1.2,1.2]). (b) Describe the filtered signal inlight of what we have discussed in the lab. Hint: Remember the Fourier Series expansion of a square wave. 2. (6 points) Using MATLAB, we want to plot the transfer function of the Butterworth filter. (a) Define the sampling frequency fs = 100 x 10000 . Also, compute ts from fg as we have done in Exp 2. Also define the simulation time (t) to be between -1 and 1, and compute No, and define the frequency variable f as we did in Exp 2. Show your code. (b) Define two Butterworth 8kHz low-pass filters with order 4 and 6. Show your code. (c) Generate an impulse x(t) using the command rectpulse. Set the width of the rectpulse as narrow as ts. Use the function stem to plot the generated impulse. Show your plot, and make sure the labels, title, axis are shown properly. Include your code. Filter the impulse using the generated filters in step (c), and show the transfer functions (not impulse responses) of the filters. Use a 2 x 1 figure, and subplot command to show the two transfer functions. Use the same xlim for both plots, and show only the important part of the plot. Make sure the labels, title, axis are shown properly. Include your code. (e) Comment on the transfer functions. Do they align with what we know about the filer? What is role of the filter order in the transfer function? (f) Repeat parts (c), (d), and (e) for two band-pass Butterworth filters of orders 4 and 6 with cutoff frequency 5kHz and 9kHz (d) 1. (2 points) Use the following code in MATLAB to generate a square wave, x(t). clc clear close all fs = 100*2000; %the sampling frequency ts = 1/fs; %increment t = -0.01:ts:0.01-ts; %time interval covered in the simulation NO = length(t); %number of samples in the simulation x = square (2*pi*2000*t); % generating a 1kHz square wave (a) Use a Butterworth low-pass filter of order 6 to filter x(t) such that only the fun- damental harmoic is kept. Choose the cuttoff frequency carefully. Plot the input signal x(t), and the filtered signal y(t) on the same plot. Show only 4 periods of signals in the plot, and use ylim([-1.2,1.2]). (b) Describe the filtered signal inlight of what we have discussed in the lab. Hint: Remember the Fourier Series expansion of a square wave. 2. (6 points) Using MATLAB, we want to plot the transfer function of the Butterworth filter. (a) Define the sampling frequency fs = 100 x 10000 . Also, compute ts from fg as we have done in Exp 2. Also define the simulation time (t) to be between -1 and 1, and compute No, and define the frequency variable f as we did in Exp 2. Show your code. (b) Define two Butterworth 8kHz low-pass filters with order 4 and 6. Show your code. (c) Generate an impulse x(t) using the command rectpulse. Set the width of the rectpulse as narrow as ts. Use the function stem to plot the generated impulse. Show your plot, and make sure the labels, title, axis are shown properly. Include your code. Filter the impulse using the generated filters in step (c), and show the transfer functions (not impulse responses) of the filters. Use a 2 x 1 figure, and subplot command to show the two transfer functions. Use the same xlim for both plots, and show only the important part of the plot. Make sure the labels, title, axis are shown properly. Include your code. (e) Comment on the transfer functions. Do they align with what we know about the filer? What is role of the filter order in the transfer function? (f) Repeat parts (c), (d), and (e) for two band-pass Butterworth filters of orders 4 and 6 with cutoff frequency 5kHz and 9kHz (d)


