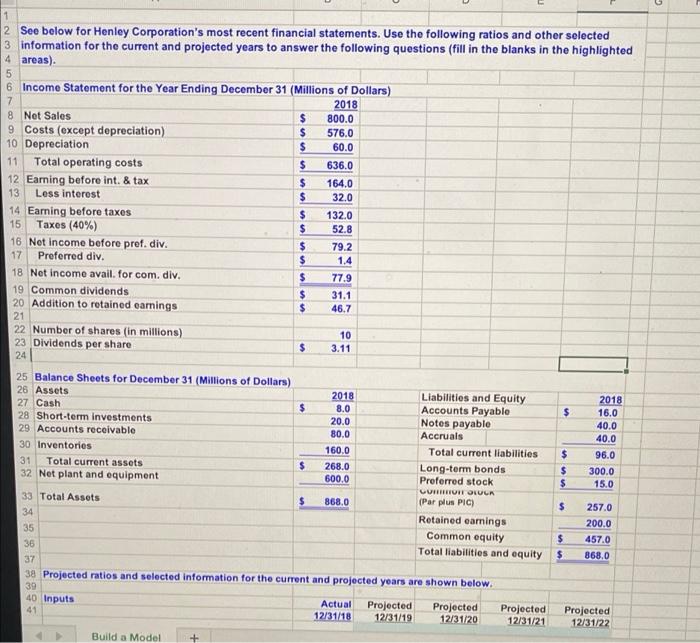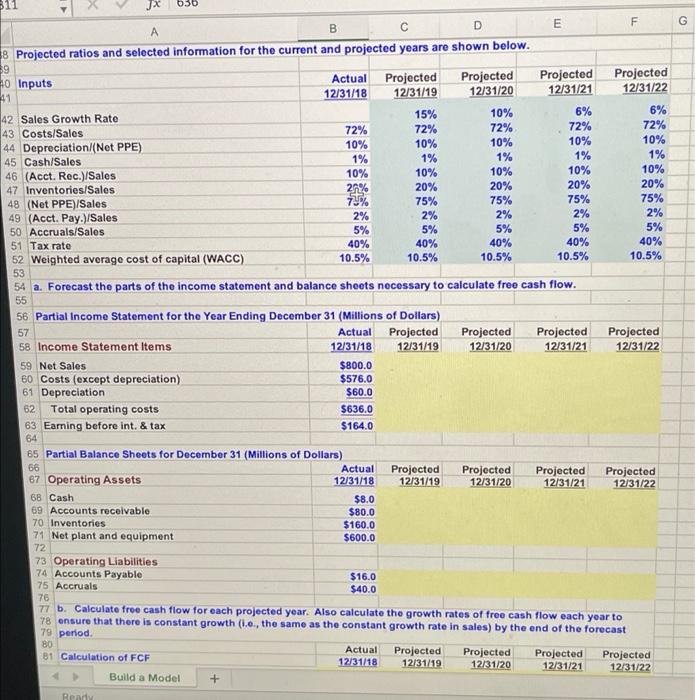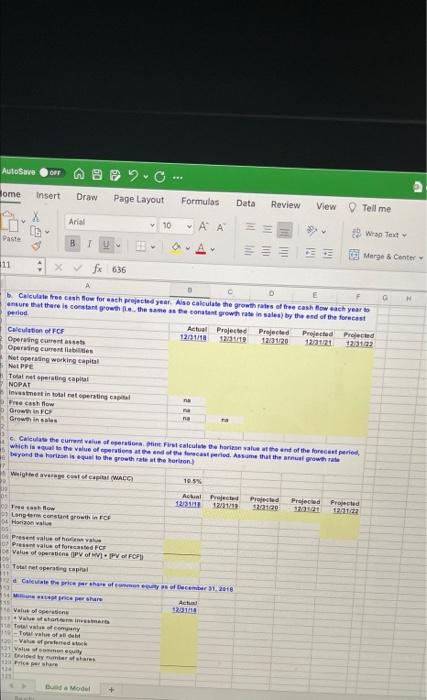
1 2 See below for Henley Corporation's most recent financial statements. Use the following ratios and other selected 3 information for the current and projected years to answer the following questions (fill in the blanks in the highlighted 4 areas). 5 6 Income Statement for the Year Ending December 31 (Millions of Dollars) 7 2018 8 Net Sales $ 800.0 9 Costs (except depreciation) $ 576.0 10 Depreciation $ 60.0 11 Total operating costs $ 636.0 12 Earning before int. & tax $ 164.0 13 Less interest $ 32.0 14 Earning before taxes $ 132.0 15 Taxes (40%) $ 52.8 16 Not income before pref. div. $ 79.2 17 Preferred div. $ 1.4 18 Net Income avail. for com. div. $ 77.9 19 Common dividends $ 31.1 20 Addition to retained earnings $ 46.7 21 22 Number of shares (in millions) 10 23 Dividends per share $ 3.11 24 25 Balance Sheets for December 31 (Millions of dollars) 26 Assets 2018 Liabilities and Equity 2018 27 Cash $ 8.0 Accounts Payable $ 16.0 28 Short-term investments 20.0 Notos payable 40.0 29 Accounts receivable 80.0 Accruals 40.0 30 Inventories 160.0 Total current liabilities $ 96.0 31 Total current assets $ 268.0 Long-term bonds $ 300.0 32 Net plant and equipment 600.0 Preferred stock $ 15.0 CURHOITOTUGA 33 Total Assets 868.0 (Par plus PIC) $ 257.0 34 Retained earings 200.0 35 Common equity $ 457.0 36 Total liabilities and equity $ 868.0 37 38 Projected ratios and selected information for the current and projected years are shown below. 39 40 Inputs Actual Projected Projected Projected Projected 41 12/31/18 12/31/19 12/31/20 12/31/21 12/31/22 Build a Model F A JX B D E F 18 Projected ratios and selected information for the current and projected years are shown below. 89 Actual Projected 40 Inputs Projected Projected Projected 12/31/18 12/31/19 41 12/31/20 12/31/21 12/31/22 15% 10% 6% 42 Sales Growth Rate 6% 72% 72% 43 Costs/Sales 72% 72% 72% 10% 10% 44 Depreciation/(Net PPE) 10% 10% 10% 1% 45 Cash/Sales 1% 1% 1% 1% 10% 10% 46 (Acct. Rec.)/Sales 10% 10% 10% 47 Inventories/Sales 20% 20% 20% 20% 20% 48 (Net PPE)/Sales 70% 75% 75% 75% 75% 49 (Acct. Pay. Sales 2% 2% 2% 2% 2% 50 Accruals/Sales 5% 5% 5% 5% 5% 51 Tax rate 40% 40% 40% 40% 40% 52 Weighted average cost of capital (WACC) 10.5% 10.5% 10.5% 10.5% 10.5% 53 54 a. Forecast the parts of the income statement and balance sheets necessary to calculate free cash flow. 55 56 Partial Income Statement for the Year Ending December 31 (Millions of Dollars) 57 Actual Projected Projected Projected Projected 58 Income Statement Items 12/31/18 12/31/19 12/31/20 12/31/21 12/31/22 59 Net Sales $800.0 60 Costs (except depreciation) $576.0 61 Depreciation $60.0 62 Total operating costs $636.0 63 Earning before int. & tax $164.0 64 65 Partial Balance Sheets for December 31 (Millions of Dollars) 66 Actual Projected Projected Projected 67 Operating Assets Projected 12/31/18 12/31/19 12/31/20 12/31/21 12/31/22 68 Cash $8.0 69 Accounts receivable $80.0 70 Inventories $160.0 71 Net plant and equipment $600.0 72 73 Operating Liabilities 74 Accounts Payable $16.0 75 Accruals $40.0 76 77 b. Calculate free cash flow for each projected year. Also calculate the growth rates of free cash flow each year to 78 ensure that there is constant growth (1.0., the same as the constant growth rate in sales) by the end of the forecast 79 period 80 Actual 81 Calculation of FCF Projected Projected Projected Projected 12/31/18 12/31/19 12/31/20 12/31/21 12/31/22 Build a Model Ready AutoSave ORT 2.C. Page Layout Formulas ome Insert Draw Data Review View Tell me Arial 10 Paste BTU Wrap Text Merge Center 11 XVfx 636 D Calculate free cash flow for each projected your Aise calculate the growth rates of the cash low each year ensure that there is constant growth the same controw in sales by the end of the forecast period Actual Projected Projected Projected Project Calculation et FCF 12/31110 12/31/19 12/31/20 12/31/21 Operating current 2013 Opring currentes Metapering working capital Net PPE Total metering capital NOPAT Investment in total metersting Espital cash flow Brown FC Grow in se na e Calculate the current value of Fiscale the end of the forcester which is to the value of the end of the carried Assume that the whole beyond the horizon is equal to the growth rate of the horison) Weighted average coloca 105 Actual Project Project 12/31 1211211 2120 Projects Projected 120122 Long-term constant growth FCF Harian Present value of here O Prent value of forecasted FC Value of operation Pow. FCF) 110 Toaletoperating capital Value of persons Act 2011 To company -Ton value of all - Valfred Values 3 yum shares da Model 1 2 See below for Henley Corporation's most recent financial statements. Use the following ratios and other selected 3 information for the current and projected years to answer the following questions (fill in the blanks in the highlighted 4 areas). 5 6 Income Statement for the Year Ending December 31 (Millions of Dollars) 7 2018 8 Net Sales $ 800.0 9 Costs (except depreciation) $ 576.0 10 Depreciation $ 60.0 11 Total operating costs $ 636.0 12 Earning before int. & tax $ 164.0 13 Less interest $ 32.0 14 Earning before taxes $ 132.0 15 Taxes (40%) $ 52.8 16 Not income before pref. div. $ 79.2 17 Preferred div. $ 1.4 18 Net Income avail. for com. div. $ 77.9 19 Common dividends $ 31.1 20 Addition to retained earnings $ 46.7 21 22 Number of shares (in millions) 10 23 Dividends per share $ 3.11 24 25 Balance Sheets for December 31 (Millions of dollars) 26 Assets 2018 Liabilities and Equity 2018 27 Cash $ 8.0 Accounts Payable $ 16.0 28 Short-term investments 20.0 Notos payable 40.0 29 Accounts receivable 80.0 Accruals 40.0 30 Inventories 160.0 Total current liabilities $ 96.0 31 Total current assets $ 268.0 Long-term bonds $ 300.0 32 Net plant and equipment 600.0 Preferred stock $ 15.0 CURHOITOTUGA 33 Total Assets 868.0 (Par plus PIC) $ 257.0 34 Retained earings 200.0 35 Common equity $ 457.0 36 Total liabilities and equity $ 868.0 37 38 Projected ratios and selected information for the current and projected years are shown below. 39 40 Inputs Actual Projected Projected Projected Projected 41 12/31/18 12/31/19 12/31/20 12/31/21 12/31/22 Build a Model F A JX B D E F 18 Projected ratios and selected information for the current and projected years are shown below. 89 Actual Projected 40 Inputs Projected Projected Projected 12/31/18 12/31/19 41 12/31/20 12/31/21 12/31/22 15% 10% 6% 42 Sales Growth Rate 6% 72% 72% 43 Costs/Sales 72% 72% 72% 10% 10% 44 Depreciation/(Net PPE) 10% 10% 10% 1% 45 Cash/Sales 1% 1% 1% 1% 10% 10% 46 (Acct. Rec.)/Sales 10% 10% 10% 47 Inventories/Sales 20% 20% 20% 20% 20% 48 (Net PPE)/Sales 70% 75% 75% 75% 75% 49 (Acct. Pay. Sales 2% 2% 2% 2% 2% 50 Accruals/Sales 5% 5% 5% 5% 5% 51 Tax rate 40% 40% 40% 40% 40% 52 Weighted average cost of capital (WACC) 10.5% 10.5% 10.5% 10.5% 10.5% 53 54 a. Forecast the parts of the income statement and balance sheets necessary to calculate free cash flow. 55 56 Partial Income Statement for the Year Ending December 31 (Millions of Dollars) 57 Actual Projected Projected Projected Projected 58 Income Statement Items 12/31/18 12/31/19 12/31/20 12/31/21 12/31/22 59 Net Sales $800.0 60 Costs (except depreciation) $576.0 61 Depreciation $60.0 62 Total operating costs $636.0 63 Earning before int. & tax $164.0 64 65 Partial Balance Sheets for December 31 (Millions of Dollars) 66 Actual Projected Projected Projected 67 Operating Assets Projected 12/31/18 12/31/19 12/31/20 12/31/21 12/31/22 68 Cash $8.0 69 Accounts receivable $80.0 70 Inventories $160.0 71 Net plant and equipment $600.0 72 73 Operating Liabilities 74 Accounts Payable $16.0 75 Accruals $40.0 76 77 b. Calculate free cash flow for each projected year. Also calculate the growth rates of free cash flow each year to 78 ensure that there is constant growth (1.0., the same as the constant growth rate in sales) by the end of the forecast 79 period 80 Actual 81 Calculation of FCF Projected Projected Projected Projected 12/31/18 12/31/19 12/31/20 12/31/21 12/31/22 Build a Model Ready AutoSave ORT 2.C. Page Layout Formulas ome Insert Draw Data Review View Tell me Arial 10 Paste BTU Wrap Text Merge Center 11 XVfx 636 D Calculate free cash flow for each projected your Aise calculate the growth rates of the cash low each year ensure that there is constant growth the same controw in sales by the end of the forecast period Actual Projected Projected Projected Project Calculation et FCF 12/31110 12/31/19 12/31/20 12/31/21 Operating current 2013 Opring currentes Metapering working capital Net PPE Total metering capital NOPAT Investment in total metersting Espital cash flow Brown FC Grow in se na e Calculate the current value of Fiscale the end of the forcester which is to the value of the end of the carried Assume that the whole beyond the horizon is equal to the growth rate of the horison) Weighted average coloca 105 Actual Project Project 12/31 1211211 2120 Projects Projected 120122 Long-term constant growth FCF Harian Present value of here O Prent value of forecasted FC Value of operation Pow. FCF) 110 Toaletoperating capital Value of persons Act 2011 To company -Ton value of all - Valfred Values 3 yum shares da Model