Answered step by step
Verified Expert Solution
Question
1 Approved Answer
1. (25 points) Sample values for n and the function T(n) are shown below, along with the values of n2 and n2 +7n: 0 0
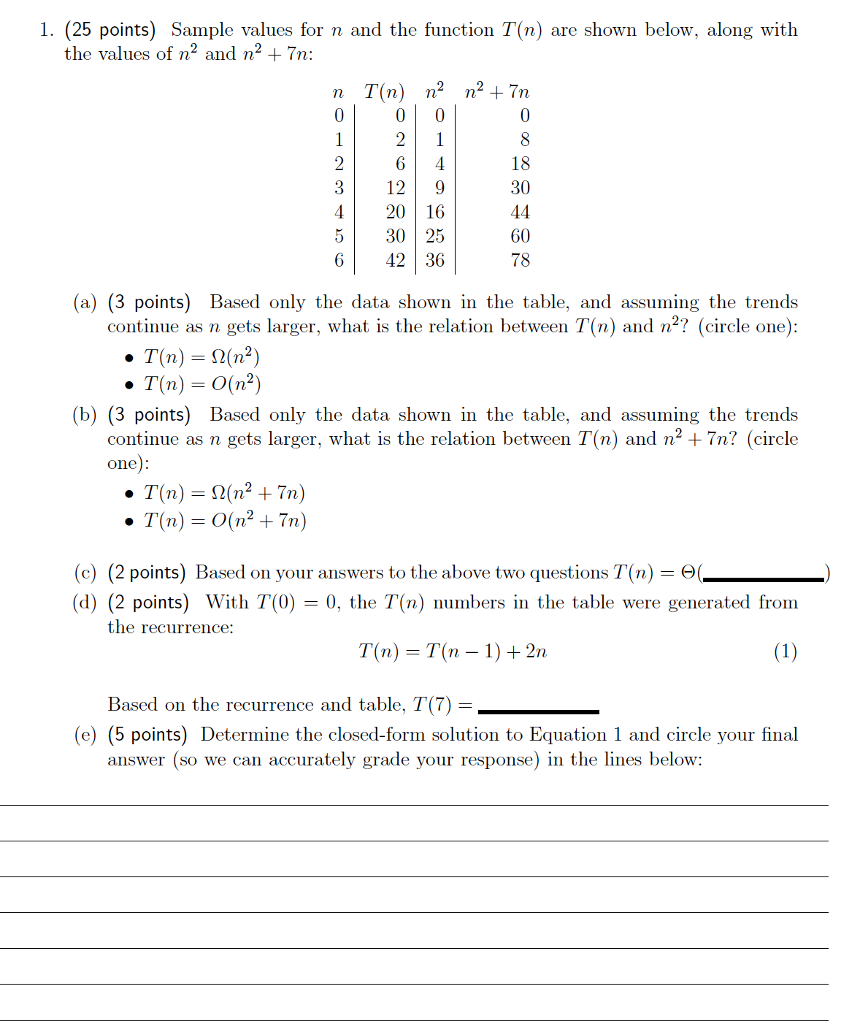
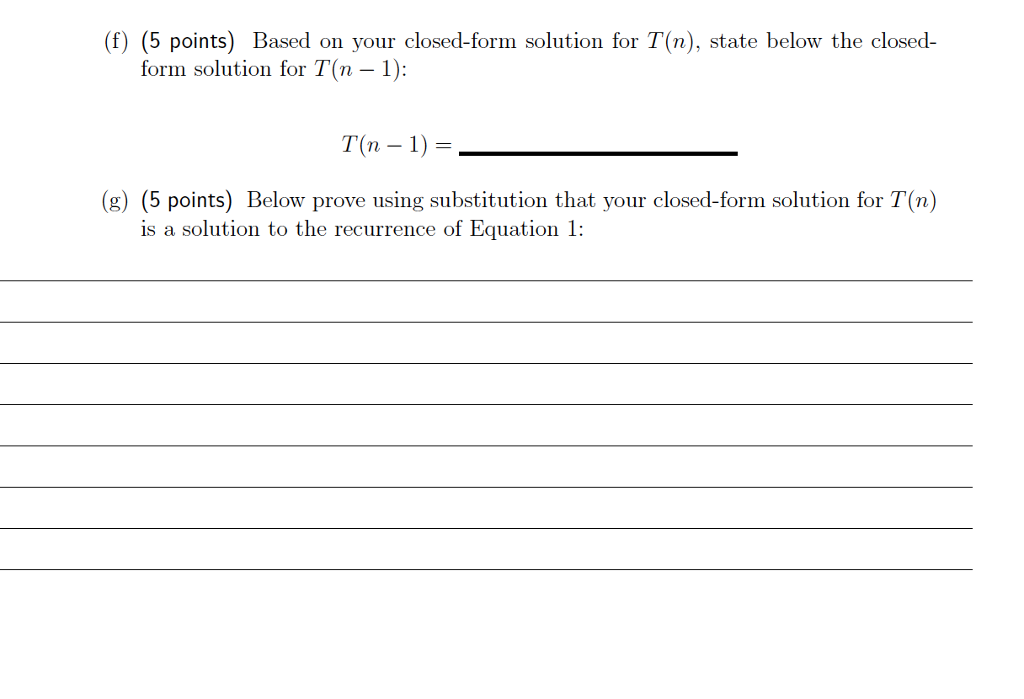
1. (25 points) Sample values for n and the function T(n) are shown below, along with the values of n2 and n2 +7n: 0 0 18 30 3129 4 20 16 530 25 6 42 36 60 78 (a) (3 points) Based only the data shown in the table, and assuming the trends continue as n gets larger, what is the relation between T(n) and n? (circle one) T(n) = () T(n) = 0(n2) (b) (3 points) Based only the data shown in the table, and assuming the trends continue as n gets larger, what is the relation between T(n) and n2 + 7n? (circle one (c) (2 points) Based on your answers to the above two questions T(n) (d) (2 points) with T(0) = 0, the T(n) numbers in the table were generated from! the recurrence: T(n) = T(n-1 ) +2n Based on the recurrence and table. T(7) (e) (5 points) Determine the closed-form solution to Equation 1 and circle your final answer (so we can accurately grade your response) in the lines below
Step by Step Solution
There are 3 Steps involved in it
Step: 1
Get Instant Access to Expert-Tailored Solutions
See step-by-step solutions with expert insights and AI powered tools for academic success
Step: 2
Step: 3
Ace Your Homework with AI
Get the answers you need in no time with our AI-driven, step-by-step assistance
Get Started