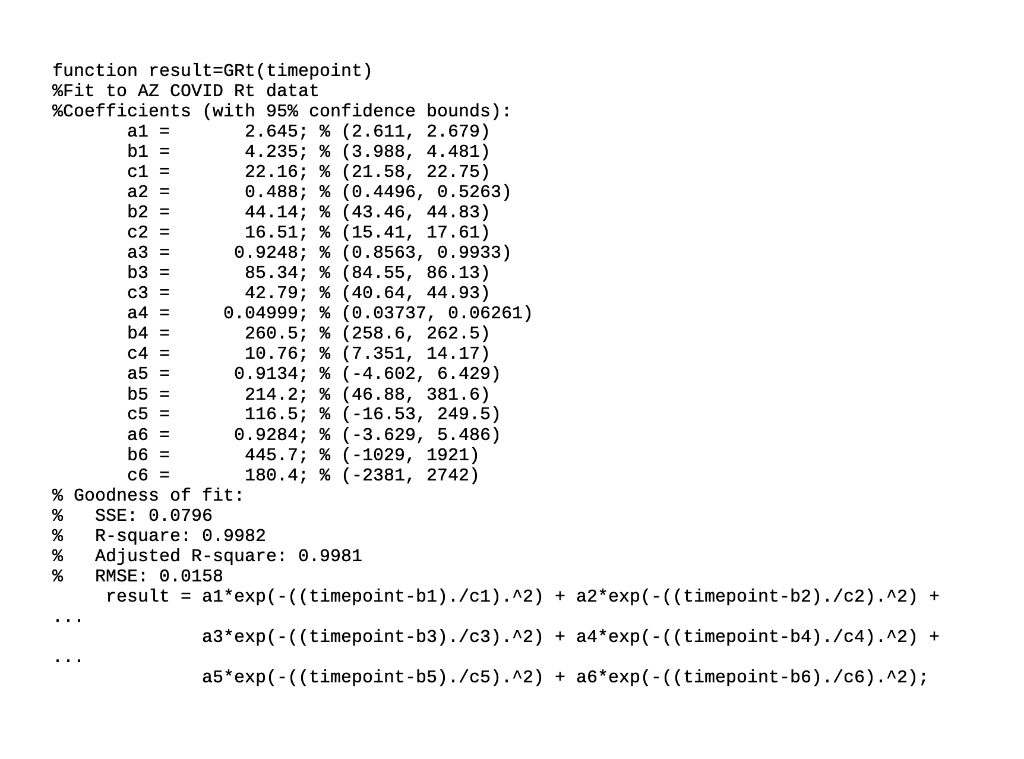
1. [3 points] Show how to express the number 1/22 in binary (base 2) format. Assume that there are 7 bits in the mantissa. 2. You are assigned to work on a retrospective analysis of COVID-19 data. You have obtained data plotting the dynamic reproductive number (Rt) of the virus within Arizona over a 337- day time period. A six-term Gaussian curve called GRt has been determined, that outputs Rt as a continuous function of time. This function is available via a link in the HW2 statement. Your job is to determine when the Rt was exactly 1.0. You can do this by finding the zeros of GRt-1. Follow the steps below to find the times when GRt-1=0. 1) [2 points] Using MATLAB, create a new function that will output GRt(t)-1 for any value. ii) [1 point] Plot this function over the whole time range of 337 days and by inspection guess the approximate timepoints where GRt(t)-1=0. ii) Choose one interval [a b] inside which GRt(t)-1 goes through 0. Call this your starting interval Write it into your answer, then use this interval to find the time where GRt(t)- 1=0 using t iv) [4 points] the Bisection Method; and v) [5 points] the Method of False Position. function result=GRt(timepoint) %Fit to AZ COVID Rt datat %Coefficients (with 95% confidence bounds): al = 2.645; % (2.611, 2.679) b1 = 4.235; % (3.988, 4.481) c1 = 22.16; % (21.58, 22.75) a 2 = 0.488; % (0.4496, 0.5263) b2 = 44.14; % (43.46, 44.83) C2 = 16.51; % (15.41, 17.61) a3 = 0.9248; % (0.8563, 0.9933) b3 = 85.34; % (84.55, 86.13) c3 = 42.79; % (40.64, 44.93) a4 = 0.04999; % (0.03737, 0.06261) b4 = 260.5; % (258.6, 262.5) c4 = 10.76; % (7.351, 14.17) a5 = 0.9134; % (-4.602, 6.429) b5 = 214.2; % (46.88, 381.6) c5 = 116.5; % (-16.53, 249.5) a6 = 0.9284; % (-3.629, 5.486) b6 = 445.7; % (-1029, 1921) C6 = 180.4; % (-2381, 2742) % Goodness of fit: % SSE: 0.0796 % R-square: 0.9982 % Adjusted R-square: 0.9981 % RMSE: 0.0158 result = a1*exp(-((timepoint-b1)./c1).^2) + a2*exp(-((timepoint-b2)./c2).^2) + a3*exp(-((timepoint-b3)./c3).^2) + a4*exp(-((timepoint-b4)./c4).^2) + a5*exp(-((timepoint-b5)./c5).^2) + a6*exp(-((timepoint-b6)./06).^2); 1. [3 points] Show how to express the number 1/22 in binary (base 2) format. Assume that there are 7 bits in the mantissa. 2. You are assigned to work on a retrospective analysis of COVID-19 data. You have obtained data plotting the dynamic reproductive number (Rt) of the virus within Arizona over a 337- day time period. A six-term Gaussian curve called GRt has been determined, that outputs Rt as a continuous function of time. This function is available via a link in the HW2 statement. Your job is to determine when the Rt was exactly 1.0. You can do this by finding the zeros of GRt-1. Follow the steps below to find the times when GRt-1=0. 1) [2 points] Using MATLAB, create a new function that will output GRt(t)-1 for any value. ii) [1 point] Plot this function over the whole time range of 337 days and by inspection guess the approximate timepoints where GRt(t)-1=0. ii) Choose one interval [a b] inside which GRt(t)-1 goes through 0. Call this your starting interval Write it into your answer, then use this interval to find the time where GRt(t)- 1=0 using t iv) [4 points] the Bisection Method; and v) [5 points] the Method of False Position. function result=GRt(timepoint) %Fit to AZ COVID Rt datat %Coefficients (with 95% confidence bounds): al = 2.645; % (2.611, 2.679) b1 = 4.235; % (3.988, 4.481) c1 = 22.16; % (21.58, 22.75) a 2 = 0.488; % (0.4496, 0.5263) b2 = 44.14; % (43.46, 44.83) C2 = 16.51; % (15.41, 17.61) a3 = 0.9248; % (0.8563, 0.9933) b3 = 85.34; % (84.55, 86.13) c3 = 42.79; % (40.64, 44.93) a4 = 0.04999; % (0.03737, 0.06261) b4 = 260.5; % (258.6, 262.5) c4 = 10.76; % (7.351, 14.17) a5 = 0.9134; % (-4.602, 6.429) b5 = 214.2; % (46.88, 381.6) c5 = 116.5; % (-16.53, 249.5) a6 = 0.9284; % (-3.629, 5.486) b6 = 445.7; % (-1029, 1921) C6 = 180.4; % (-2381, 2742) % Goodness of fit: % SSE: 0.0796 % R-square: 0.9982 % Adjusted R-square: 0.9981 % RMSE: 0.0158 result = a1*exp(-((timepoint-b1)./c1).^2) + a2*exp(-((timepoint-b2)./c2).^2) + a3*exp(-((timepoint-b3)./c3).^2) + a4*exp(-((timepoint-b4)./c4).^2) + a5*exp(-((timepoint-b5)./c5).^2) + a6*exp(-((timepoint-b6)./06).^2)