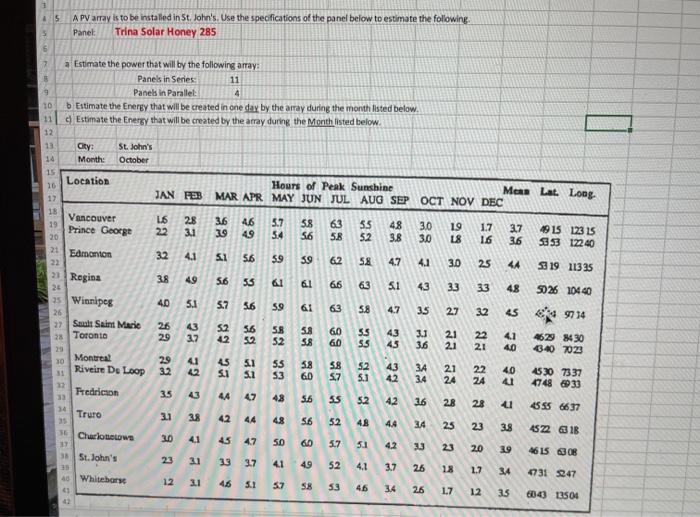
1 45 A PV array is to be installed in St. John's. Use the specifications of the panel below to estimate the following Trina Solar Honey 285 Panel a Estimate the power that will by the following array: Panels in Series 11 Panels in Parallel 4 10 Estimate the energy that will be created in one day by the array during the month listed below. 11 Estimate the energy that will be created by the array during the Month listed below. 12 13 City: St. John's 14 Month: October 15 Location 16 Hours of Peak Sunshine 17 JAN FEB MAR APR MAY JUN JUL AUG SEP Mens Lat. Long OCT NOV DEC 18 Vancouver 16 19 28 36 46 5.7 5.8 63 55 48 3.0 Prince George 19 22 1.7 39 3.1 37 20 49 1915 12315 54 56 58 52 3.8 3.0 L8 16 36 953 12240 21 Edmonton 3.2 4.1 51 59 22 39 62 5.8 47 4.1 3.0 25 44 319 11335 38 49 56 535 61 61 66 43 33 33 48 5026 10440 40 5.1 5.7 56 26 59 5.8 4.7 35 27 32 45 9734 2 Swalt Saint Marie 26 43 52 56 58 SS 60 55 2 Toronto 43 29 3.1 3.7 42 21 22 41 52 S8 4629 8430 60 SS 45 3.6 23 2.1 21 40 340 7023 30 Montreal 29 41 45 51 55 Riveire De Loop 58 S8 52 43 34 3.2 42 21 S3 22 40 60 4530 7337 57 5. 3.4 24 4 0748 6033 Fredricson 35 43 44 47 48 5.6 55 5.2 4.2 36 28 28 4555 6637 Truro 35 3.1 3,8 42 44 48 56 52 48 44 34 25 23 38 4522 18 SE Charlow 30 41 45 4.7 27 SO 60 5.7 51 4.2 33 23 20 39 4615 308 3 St. John's 33 3.7 25 41 49 52 4.1 3.7 26 18 1.7 34 731 947 40 Whitehorse 12 31 5.1 57 58 S3 45 34 26 17 12 35 6043 13504 23 Regina 25 Winnipeg 51 A2 1 45 A PV array is to be installed in St. John's. Use the specifications of the panel below to estimate the following Trina Solar Honey 285 Panel a Estimate the power that will by the following array: Panels in Series 11 Panels in Parallel 4 10 Estimate the energy that will be created in one day by the array during the month listed below. 11 Estimate the energy that will be created by the array during the Month listed below. 12 13 City: St. John's 14 Month: October 15 Location 16 Hours of Peak Sunshine 17 JAN FEB MAR APR MAY JUN JUL AUG SEP Mens Lat. Long OCT NOV DEC 18 Vancouver 16 19 28 36 46 5.7 5.8 63 55 48 3.0 Prince George 19 22 1.7 39 3.1 37 20 49 1915 12315 54 56 58 52 3.8 3.0 L8 16 36 953 12240 21 Edmonton 3.2 4.1 51 59 22 39 62 5.8 47 4.1 3.0 25 44 319 11335 38 49 56 535 61 61 66 43 33 33 48 5026 10440 40 5.1 5.7 56 26 59 5.8 4.7 35 27 32 45 9734 2 Swalt Saint Marie 26 43 52 56 58 SS 60 55 2 Toronto 43 29 3.1 3.7 42 21 22 41 52 S8 4629 8430 60 SS 45 3.6 23 2.1 21 40 340 7023 30 Montreal 29 41 45 51 55 Riveire De Loop 58 S8 52 43 34 3.2 42 21 S3 22 40 60 4530 7337 57 5. 3.4 24 4 0748 6033 Fredricson 35 43 44 47 48 5.6 55 5.2 4.2 36 28 28 4555 6637 Truro 35 3.1 3,8 42 44 48 56 52 48 44 34 25 23 38 4522 18 SE Charlow 30 41 45 4.7 27 SO 60 5.7 51 4.2 33 23 20 39 4615 308 3 St. John's 33 3.7 25 41 49 52 4.1 3.7 26 18 1.7 34 731 947 40 Whitehorse 12 31 5.1 57 58 S3 45 34 26 17 12 35 6043 13504 23 Regina 25 Winnipeg 51 A2