

Answered step by step
Verified Expert Solution
Question
1 Approved Answer
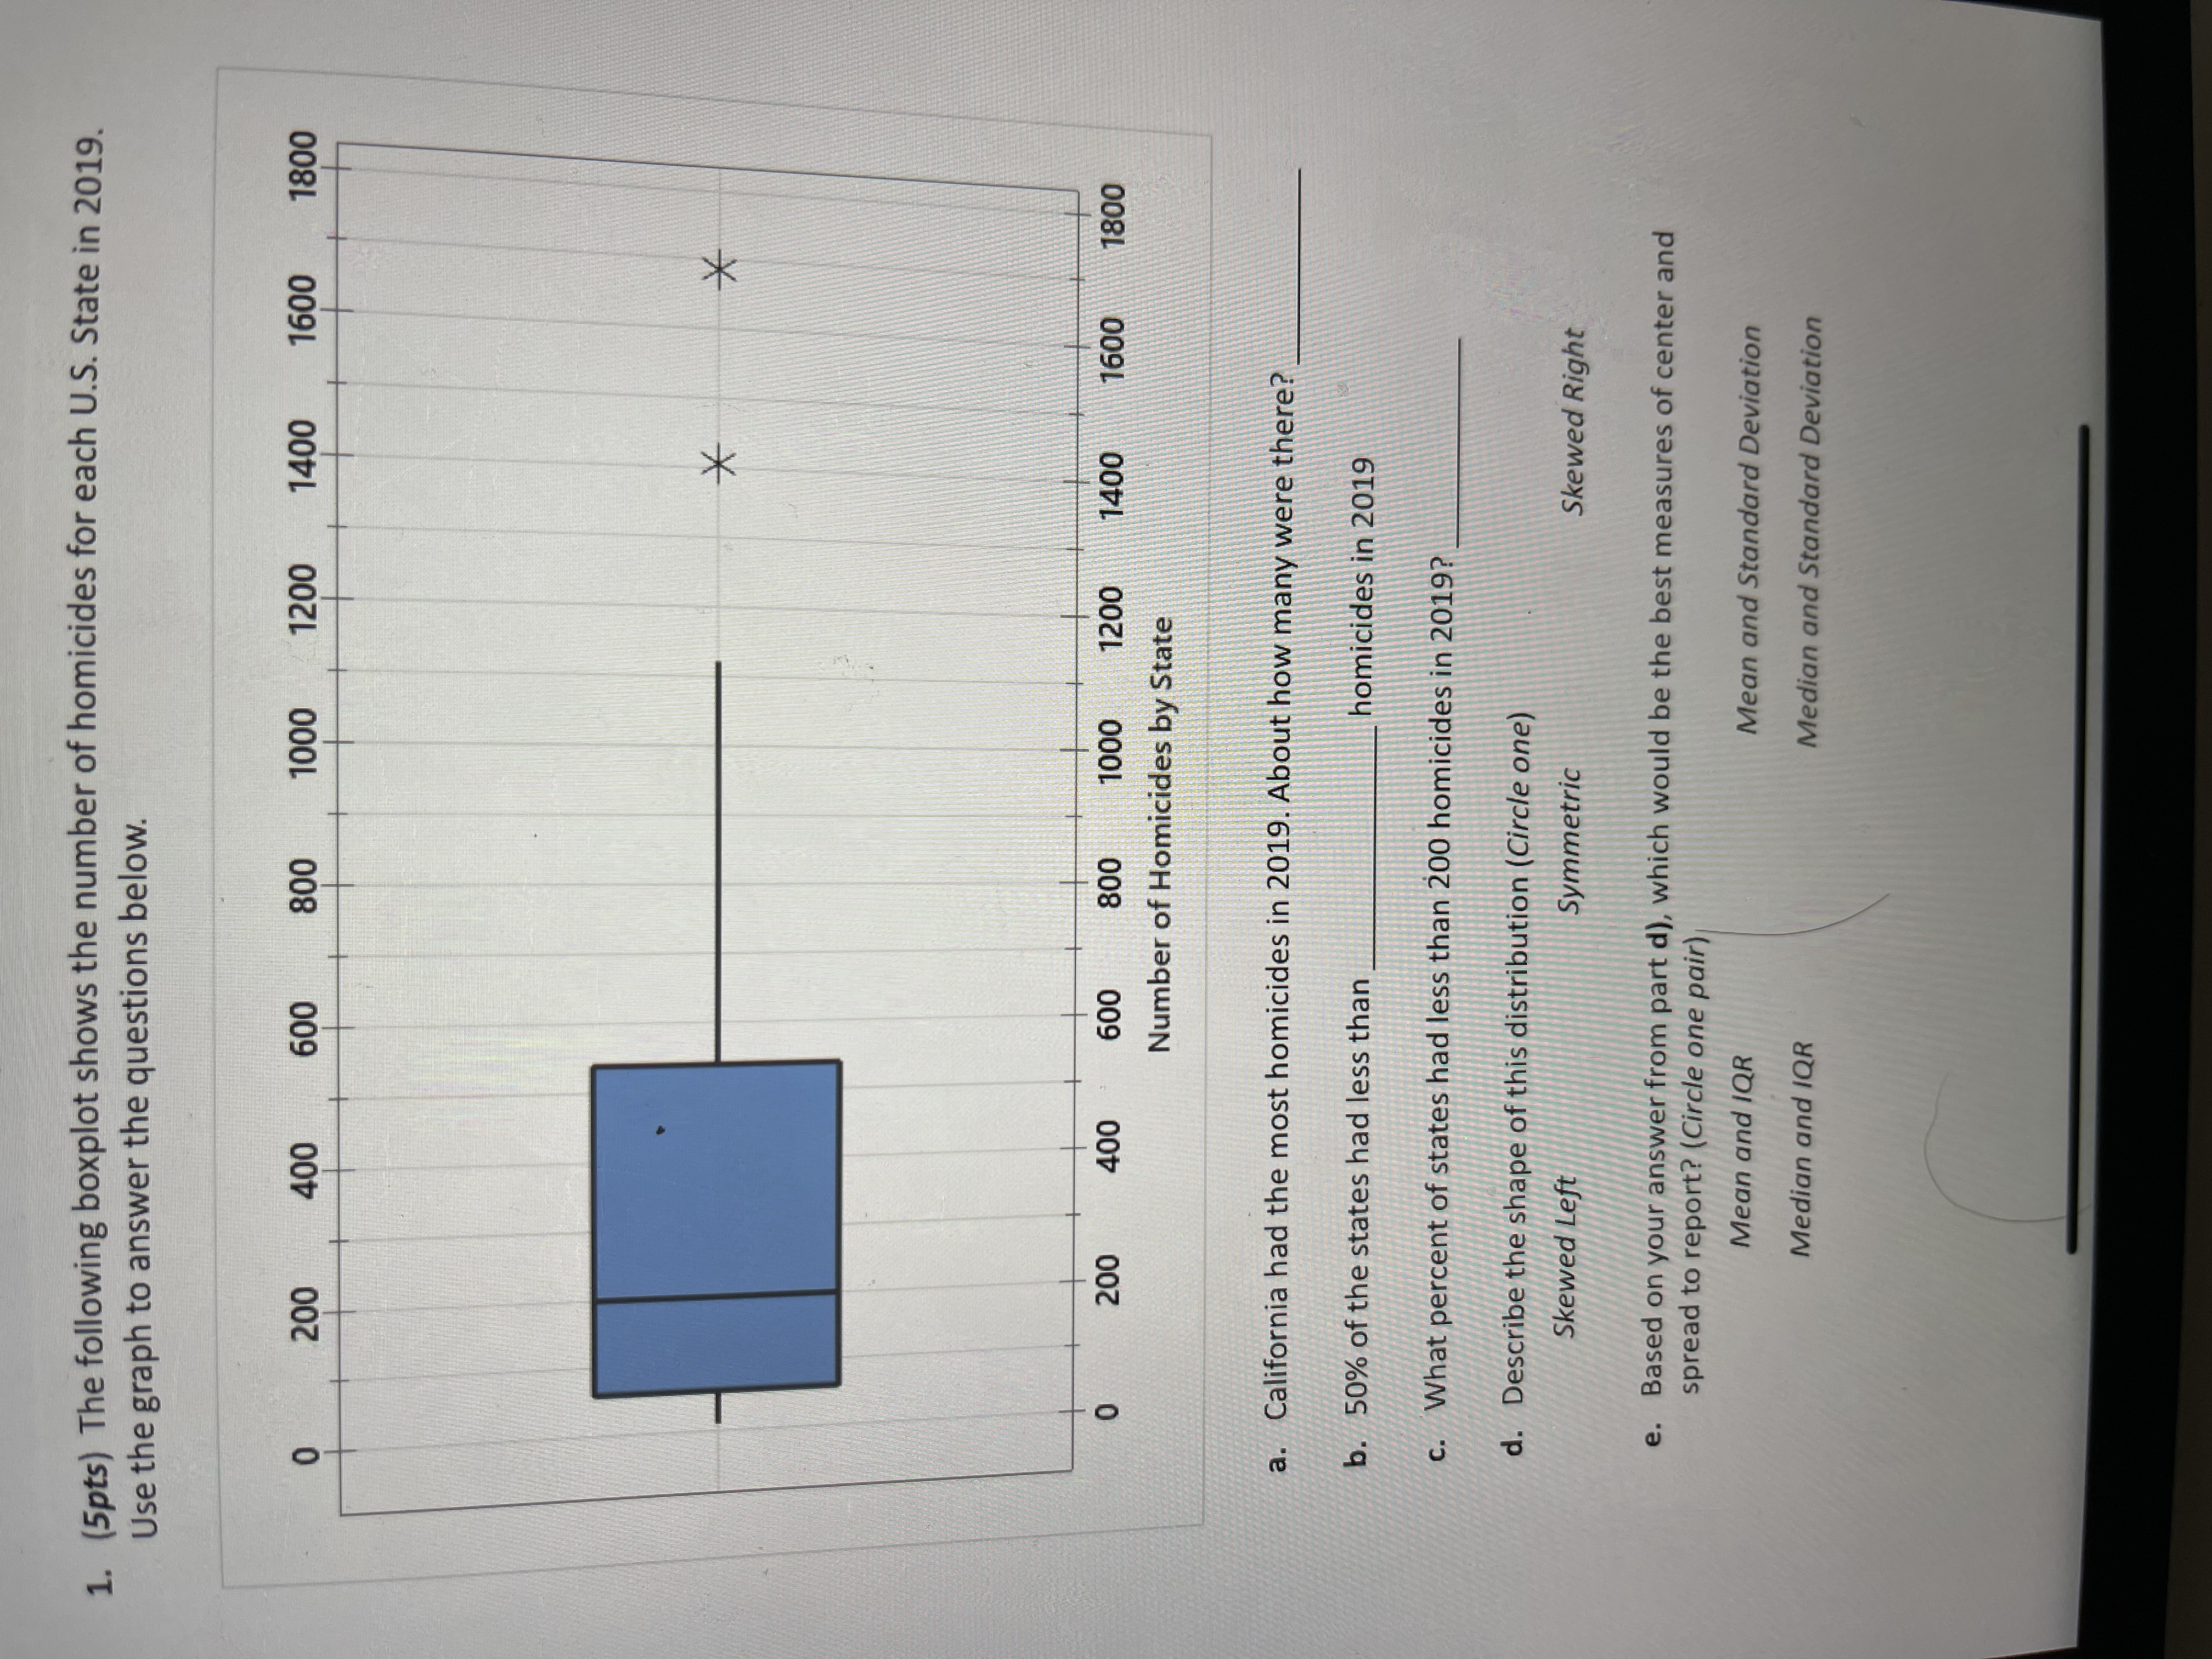
1. (5pts) The following boxplot shows the number of homicides for each U.S. State in 2019. Use the graph to answer the questions below. 0
Step by Step Solution
There are 3 Steps involved in it
Step: 1

Get Instant Access to Expert-Tailored Solutions
See step-by-step solutions with expert insights and AI powered tools for academic success
Step: 2

Step: 3
Ace Your Homework with AI
Get the answers you need in no time with our AI-driven, step-by-step assistance
Get Started
Calculus Early Transcendentals
Authors: Michael Sullivan, Kathleen Miranda
2nd Edition
1319067484, 9781319067489