Answered step by step
Verified Expert Solution
Question
1 Approved Answer
1 6 . 1 University Rankings. The dataset miba:: Universities on American College and Uni - verity Rankings contains information on 1 3 0 2
University Rankings. The dataset miba:: Universities on American College and Univerity Rankings contains information on American colleges and universities ofering an undergraduate program. For each university, there are measurements, including continuous variables such as tuition and graduation rate and categorical variables such as location by state and whether it is a private or public school
Note that many records are missing some measurements. Our first goal is to estimate these missing values from "similar" records. This will be done by clustering the complete records and then finding the closest cluster for each of the partial records.
The missing values will be imputed from the information in that cluster.
a Remove all records with missing measurements from the dataset.
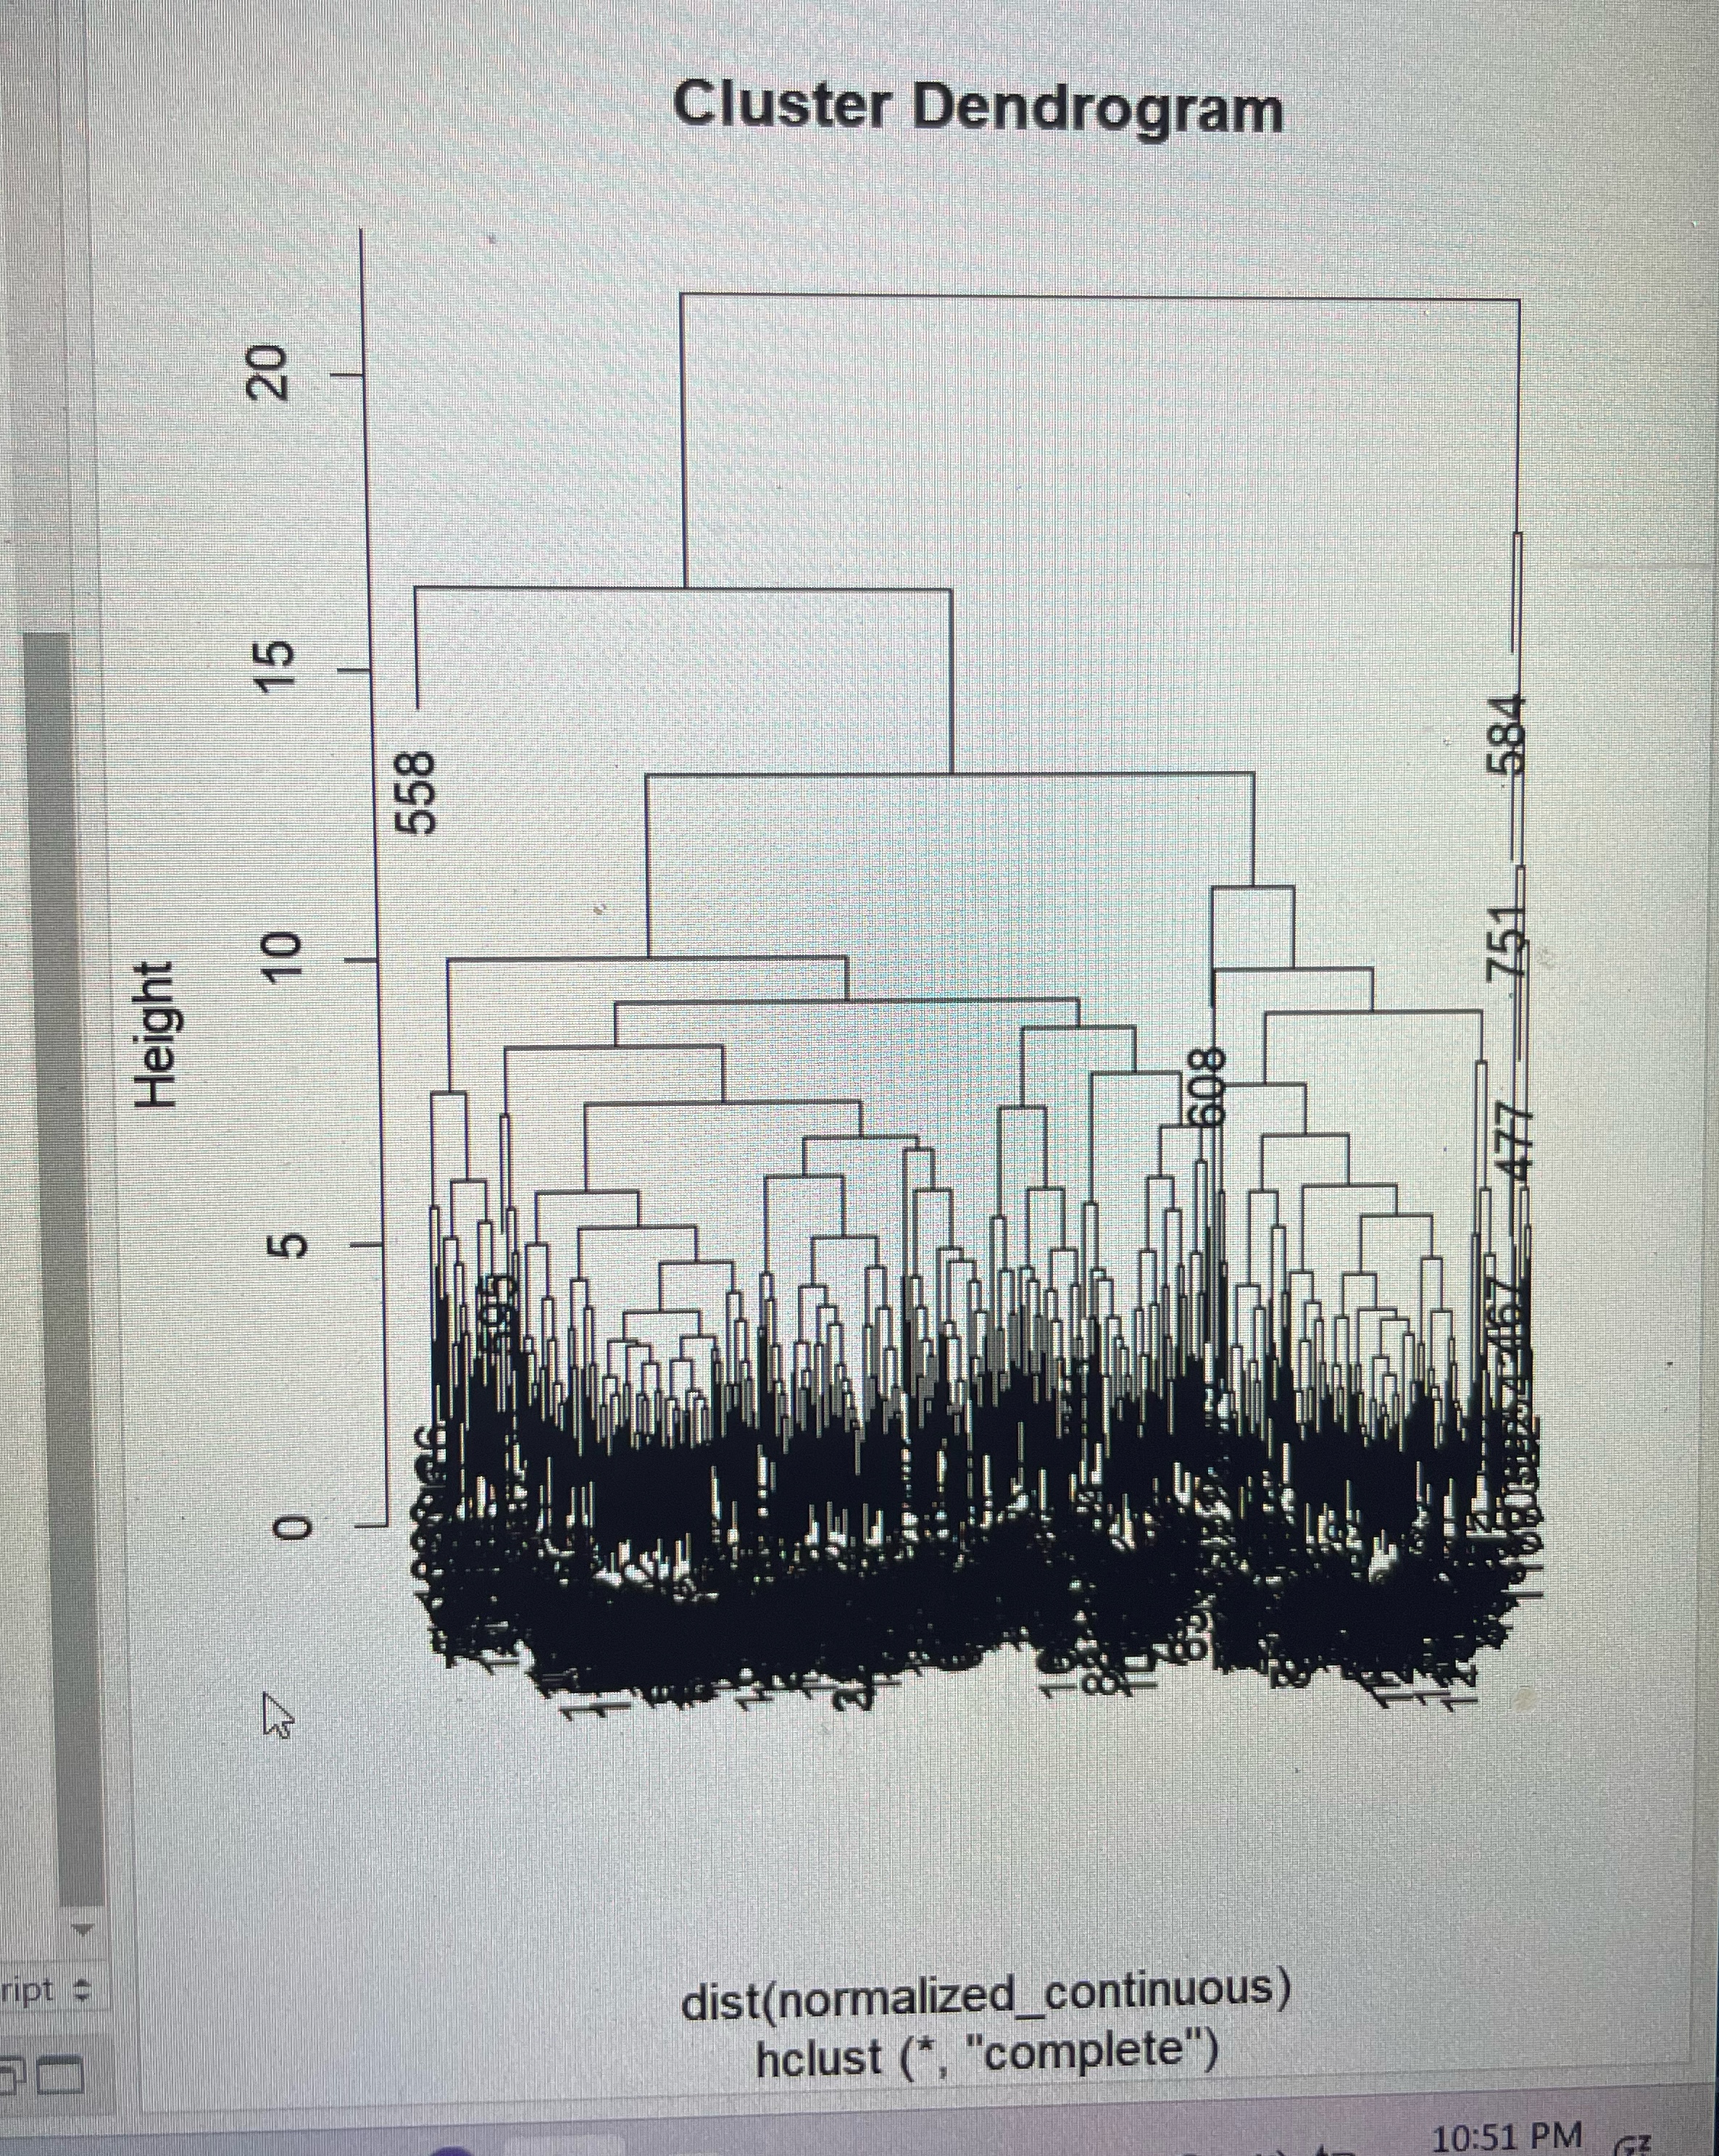
b For all the continuous variables, run hierarchical clustering using complete linkage and Euclidean distance. Make sure to normalize the variables. From the dendrogram: how many clusters seem reasonable for describing these data?
c Compare the summary statistics for each cluster, and describe each cluster in this context eg "Universities with high tuition, low acceptance rate..." Hint: To obtain cluster statistics for hierarchical clustering, use the aggregate function.
d Use the categorical variables that were not used in the analysis State and PrivatePublic to characterize the different clusters. Is there any relationship between the clusters and the categorical information?
e What other external information can explain the contents of some or all of these clusters?
f Consider Tufts University, which is missing some information. Compute the Euclidean distance of this record from each of the clusters that you found above using only the variables that you have Which cluster is it closest to Impute the missing values for Tufts by taking the average of the cluster on those variables.
# a
data mba::Universities
# Remove records with missing measurements
completedata naomitdata
# b
continuousvars completedata c
Xappirec.dXappaccepted", Xnew.stud..enroled",
X new. stud. from. topXnew.stud. from. topXFT undergrad",
XPT undergrad", instate.tuition", "out.ofstate.tuition", "room",
"board", "add. fees", "estim. book. costs", "estim. persona
xfac..wPHD "stud..fac..ratio", "Graduation.rate"
# Normalize the continuous variables
normalizedcontinuous scalecontinuousvars
# Perform hierarchical clustering
hclustresult hclustdistnormalizedcontinuous method "complete"
# Plot dendrogram
plot hclustresult
#
numclusters
clusterassignments cutreehclustresult, numclusters
# Combine cluster assignments with data
clustereddata cbindcompletedata, Cluster clusterassignments
# Compute summary statistics for each cluster
clusterstats aggregatecontinuousvars, by listCluster clusterassignments FUN summary
# d
categoricalvars completedata cState "Public.Private..
clusteredcategorical cbindcategoricalvars, Cluster clusterassignments
#
Top Level
#
tufts completedatacompletedata$colege. Name "Tufts University", tuftscontinuous tufts c
X apprec.dX appaccepted", Xnew.stud.. enroed
X new. stud. from. topX new.stud..from.topXFTundergrad",
XPT undergrad", instate.tuition", "out. ofstate.tuition", "room", "board", "add..fees", "estim. book.costs", "estim..persona
Xfac..wPHD "stud..fac..ratio", "Graduation. rate"
tuftsdistances sapply:numclusters, functioni
clustermean colMeans continuousvars clusterassignments

Step by Step Solution
There are 3 Steps involved in it
Step: 1

Get Instant Access to Expert-Tailored Solutions
See step-by-step solutions with expert insights and AI powered tools for academic success
Step: 2

Step: 3

Ace Your Homework with AI
Get the answers you need in no time with our AI-driven, step-by-step assistance
Get Started


