

Answered step by step
Verified Expert Solution
Question
1 Approved Answer
1 7 : 5 2 4 Assignment 2 PROBLEMS Suppose that on July 2 5 , 2 0 1 4 you purchased shares in Tesla
: Assignment PROBLEMS Suppose that on July you purchased shares in Tesla Inc. Nasdaq: TSLA It is now five years later and you decide to evaluate your holdings to see if you have done well with this investment. The table below shows the end of July market prices of TSLA. tableTSLA Stock PricesDatePrice a Enter the data into a worksheet and format the table as shown. b Add a new column and use a formula to calculate your rate of return for each year. Format the data as percentages with two decimal places. c Add another column and use a formula to calculate the cumulative total return from July to the end of July of each year. Format the data as above. d Calculate the total return for the fiveyear holding period. What is the compound average annual growth rate CAGR of your investment? e Create a Line chart showing the stock price from July to July Be sure to title the chart and label the axes. Now, create an XY Scatter chart of Hints: For question C use current yearBase Year for every cell. For CAGR use GEOMEAN formula as shown in class. In your position as research assistant to a portfolio manager, you need to analyze the profitability of the companies in the portfolio. Using the data for Oracle Corporation NASDAQ: ORCL below: tableFiscal Year, 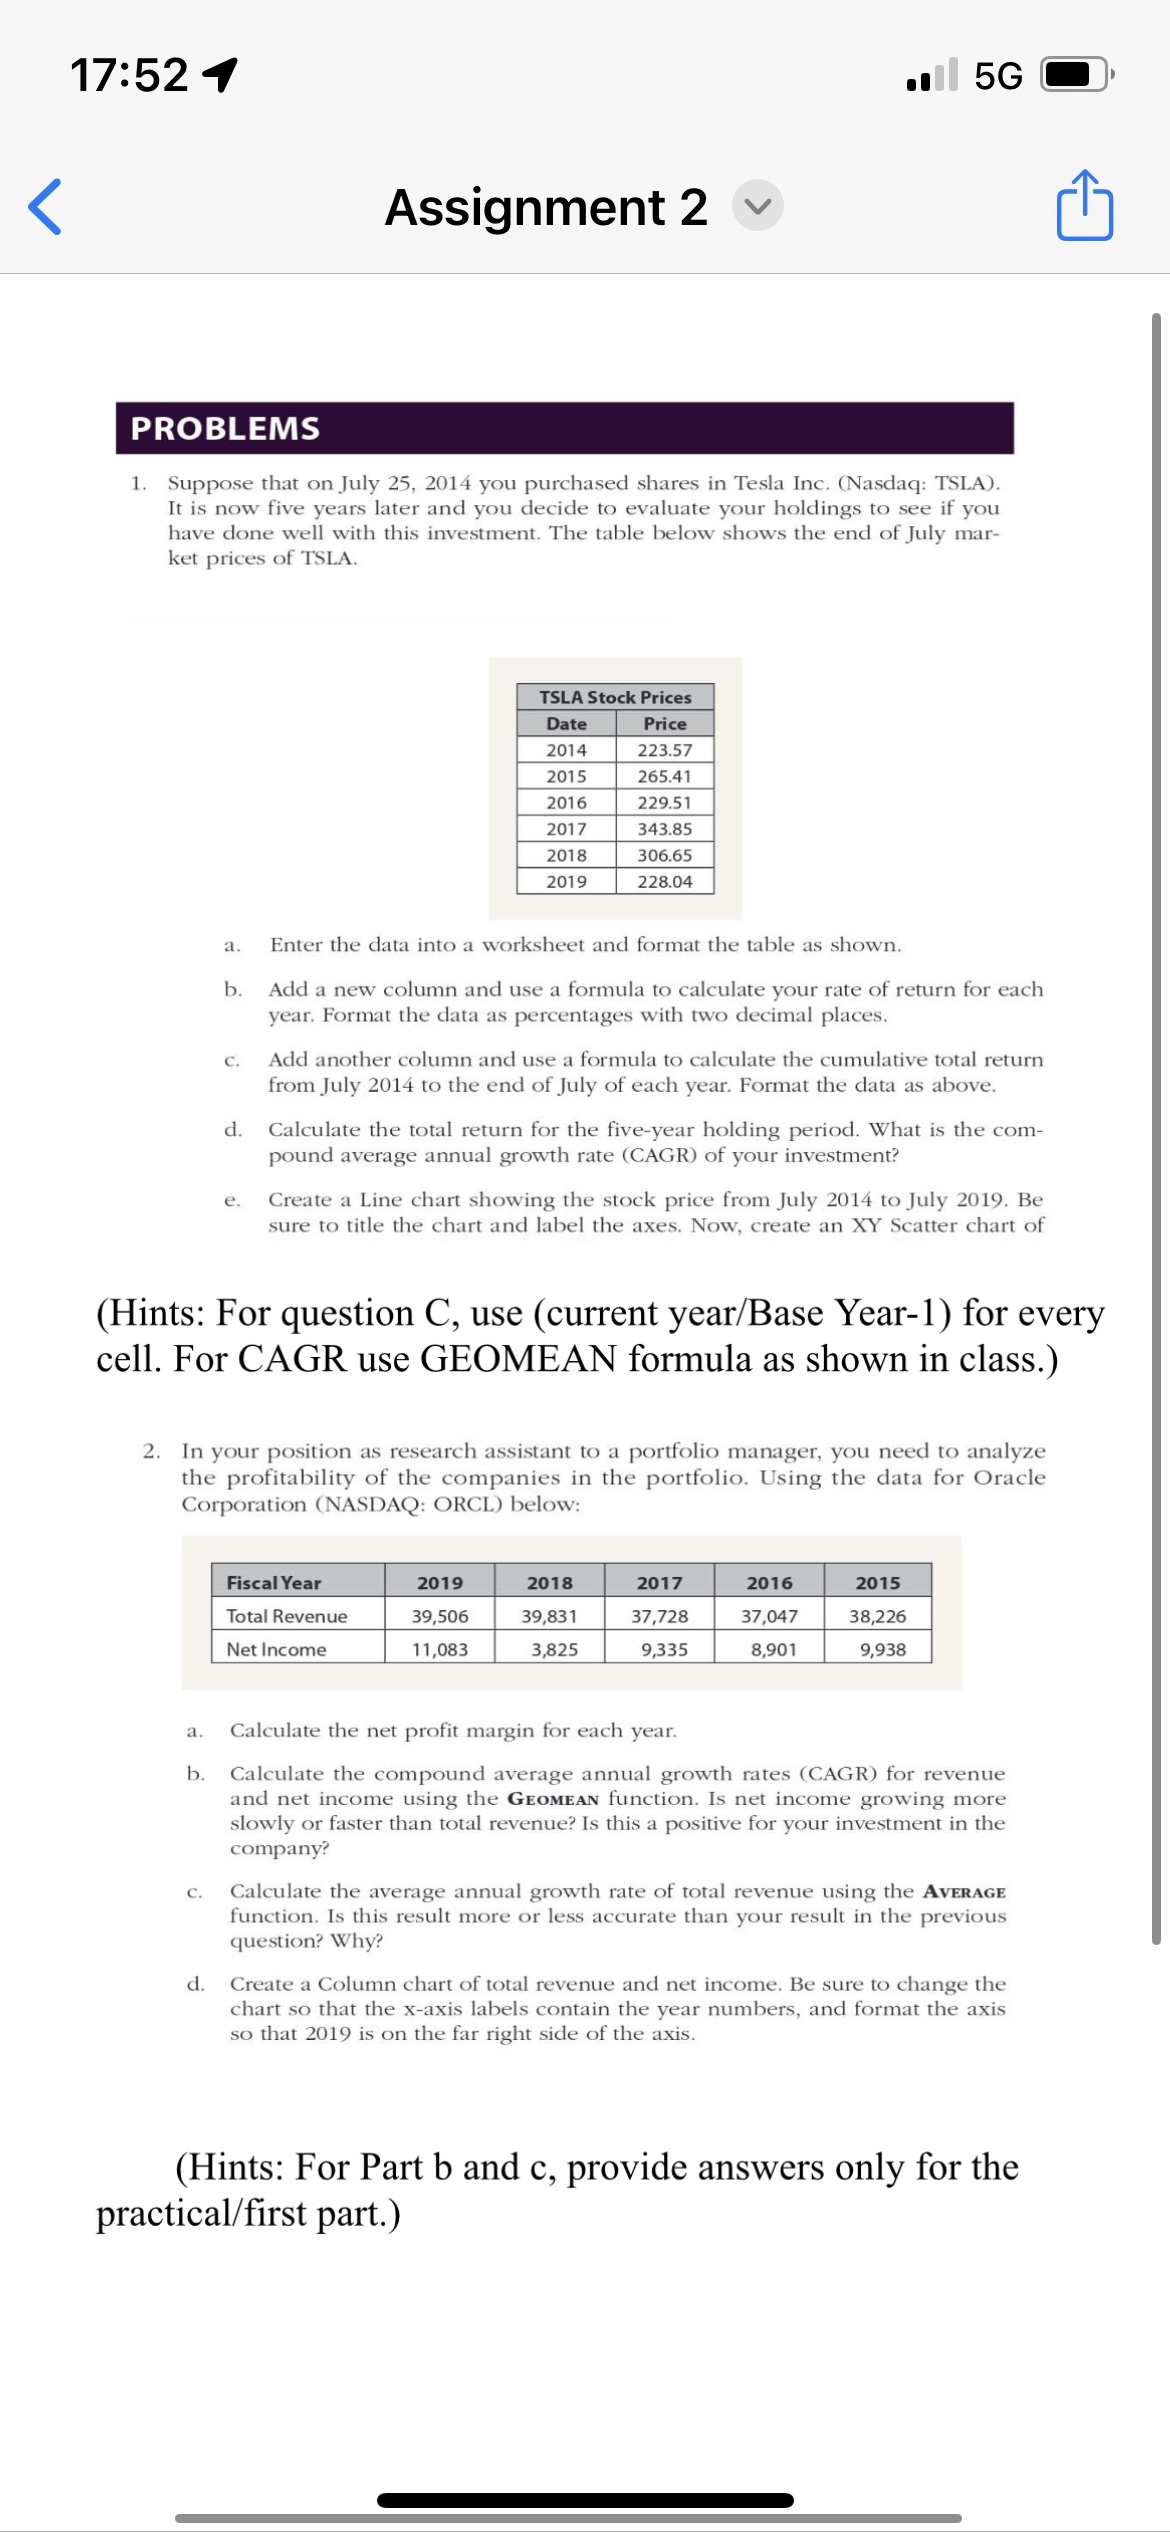
:
Assignment
PROBLEMS
Suppose that on July you purchased shares in Tesla Inc. Nasdaq: TSLA It is now five years later and you decide to evaluate your holdings to see if you have done well with this investment. The table below shows the end of July market prices of TSLA.
tableTSLA Stock PricesDatePrice
a Enter the data into a worksheet and format the table as shown.
b Add a new column and use a formula to calculate your rate of return for each year. Format the data as percentages with two decimal places.
c Add another column and use a formula to calculate the cumulative total return from July to the end of July of each year. Format the data as above.
d Calculate the total return for the fiveyear holding period. What is the compound average annual growth rate CAGR of your investment?
e Create a Line chart showing the stock price from July to July Be sure to title the chart and label the axes. Now, create an XY Scatter chart of
Hints: For question C use current yearBase Year for every cell. For CAGR use GEOMEAN formula as shown in class.
In your position as research assistant to a portfolio manager, you need to analyze the profitability of the companies in the portfolio. Using the data for Oracle Corporation NASDAQ: ORCL below:
tableFiscal Year,
Step by Step Solution
There are 3 Steps involved in it
Step: 1

Get Instant Access to Expert-Tailored Solutions
See step-by-step solutions with expert insights and AI powered tools for academic success
Step: 2

Step: 3
Ace Your Homework with AI
Get the answers you need in no time with our AI-driven, step-by-step assistance
Get Started
Fundamentals of Investing
Authors: Scott B. Smart, Lawrence J. Gitman, Michael D. Joehnk
12th edition
978-0133075403, 133075354, 9780133423938, 133075400, 013342393X, 978-0133075359