1. A consumer testing laboratory measured the calories per hot dog in 20 brands of beef hot dogs. Here are the results: 186 181 176
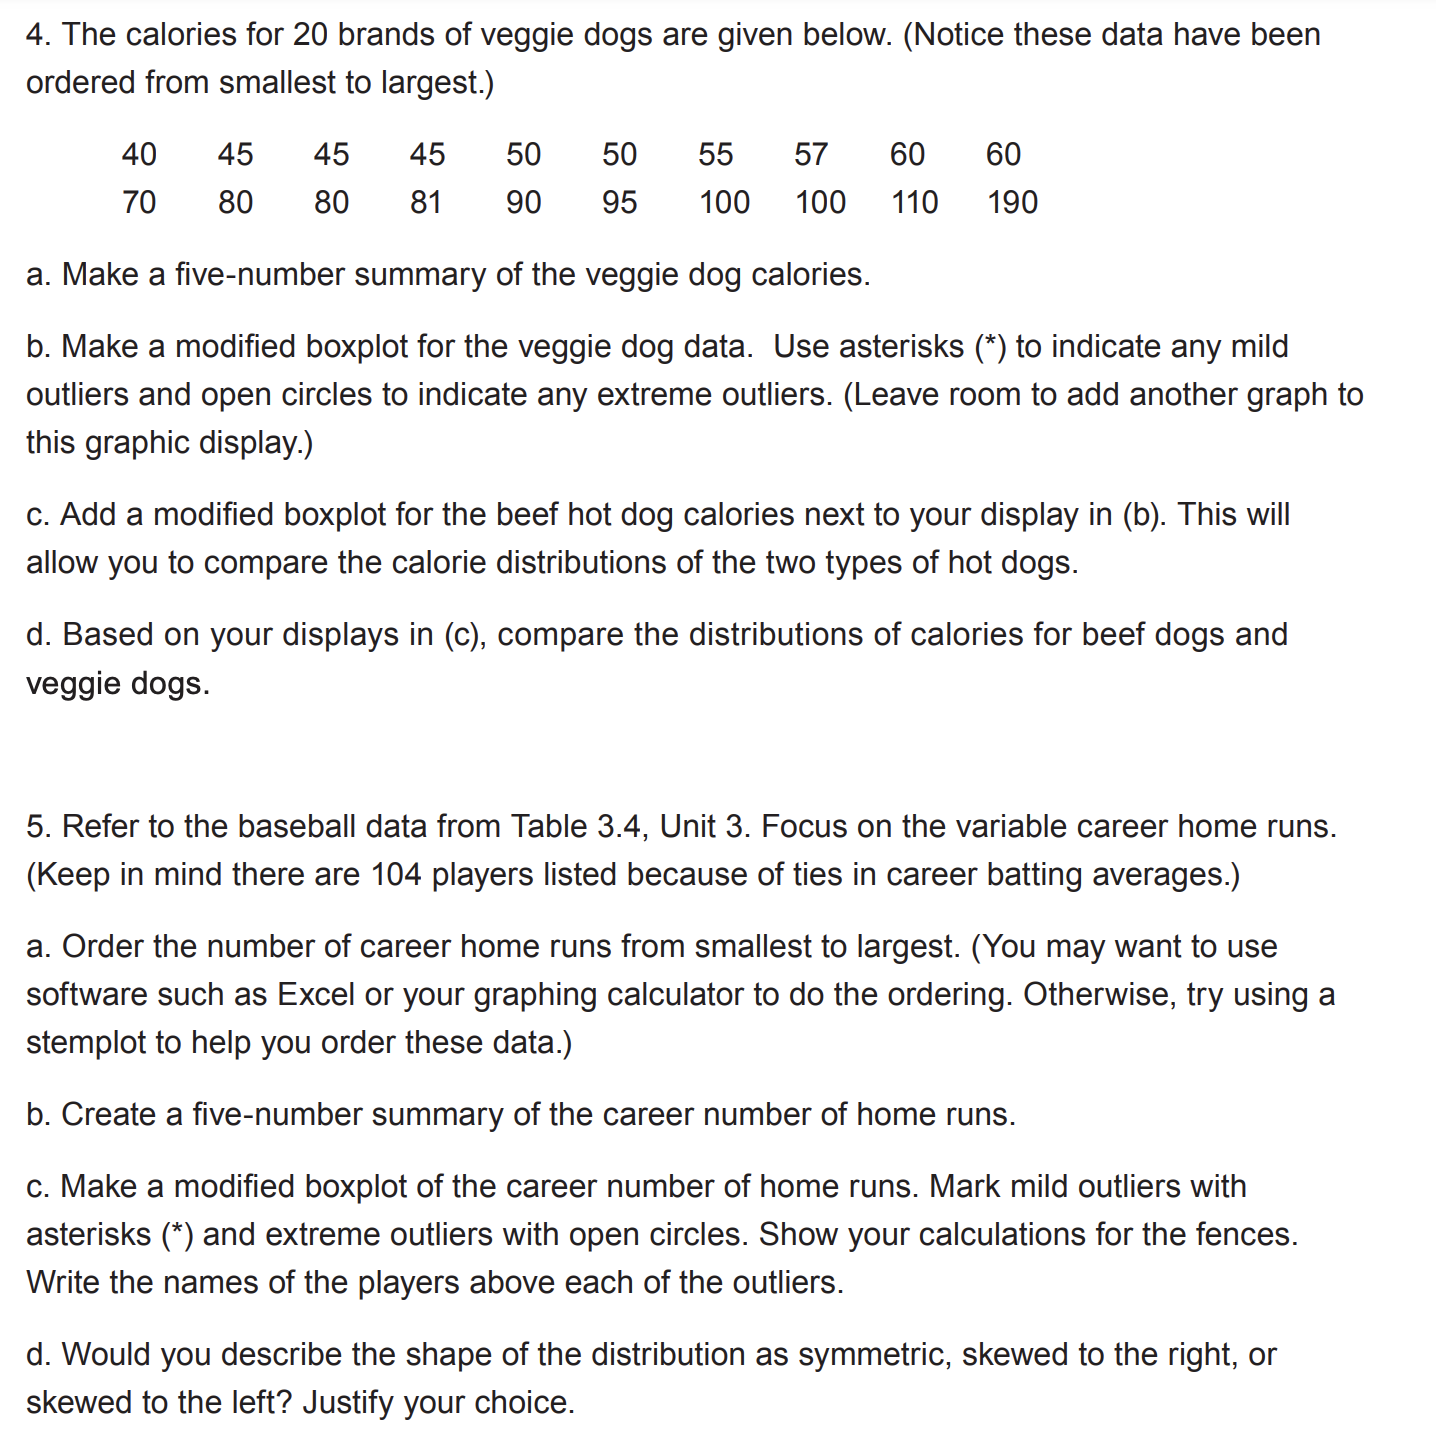
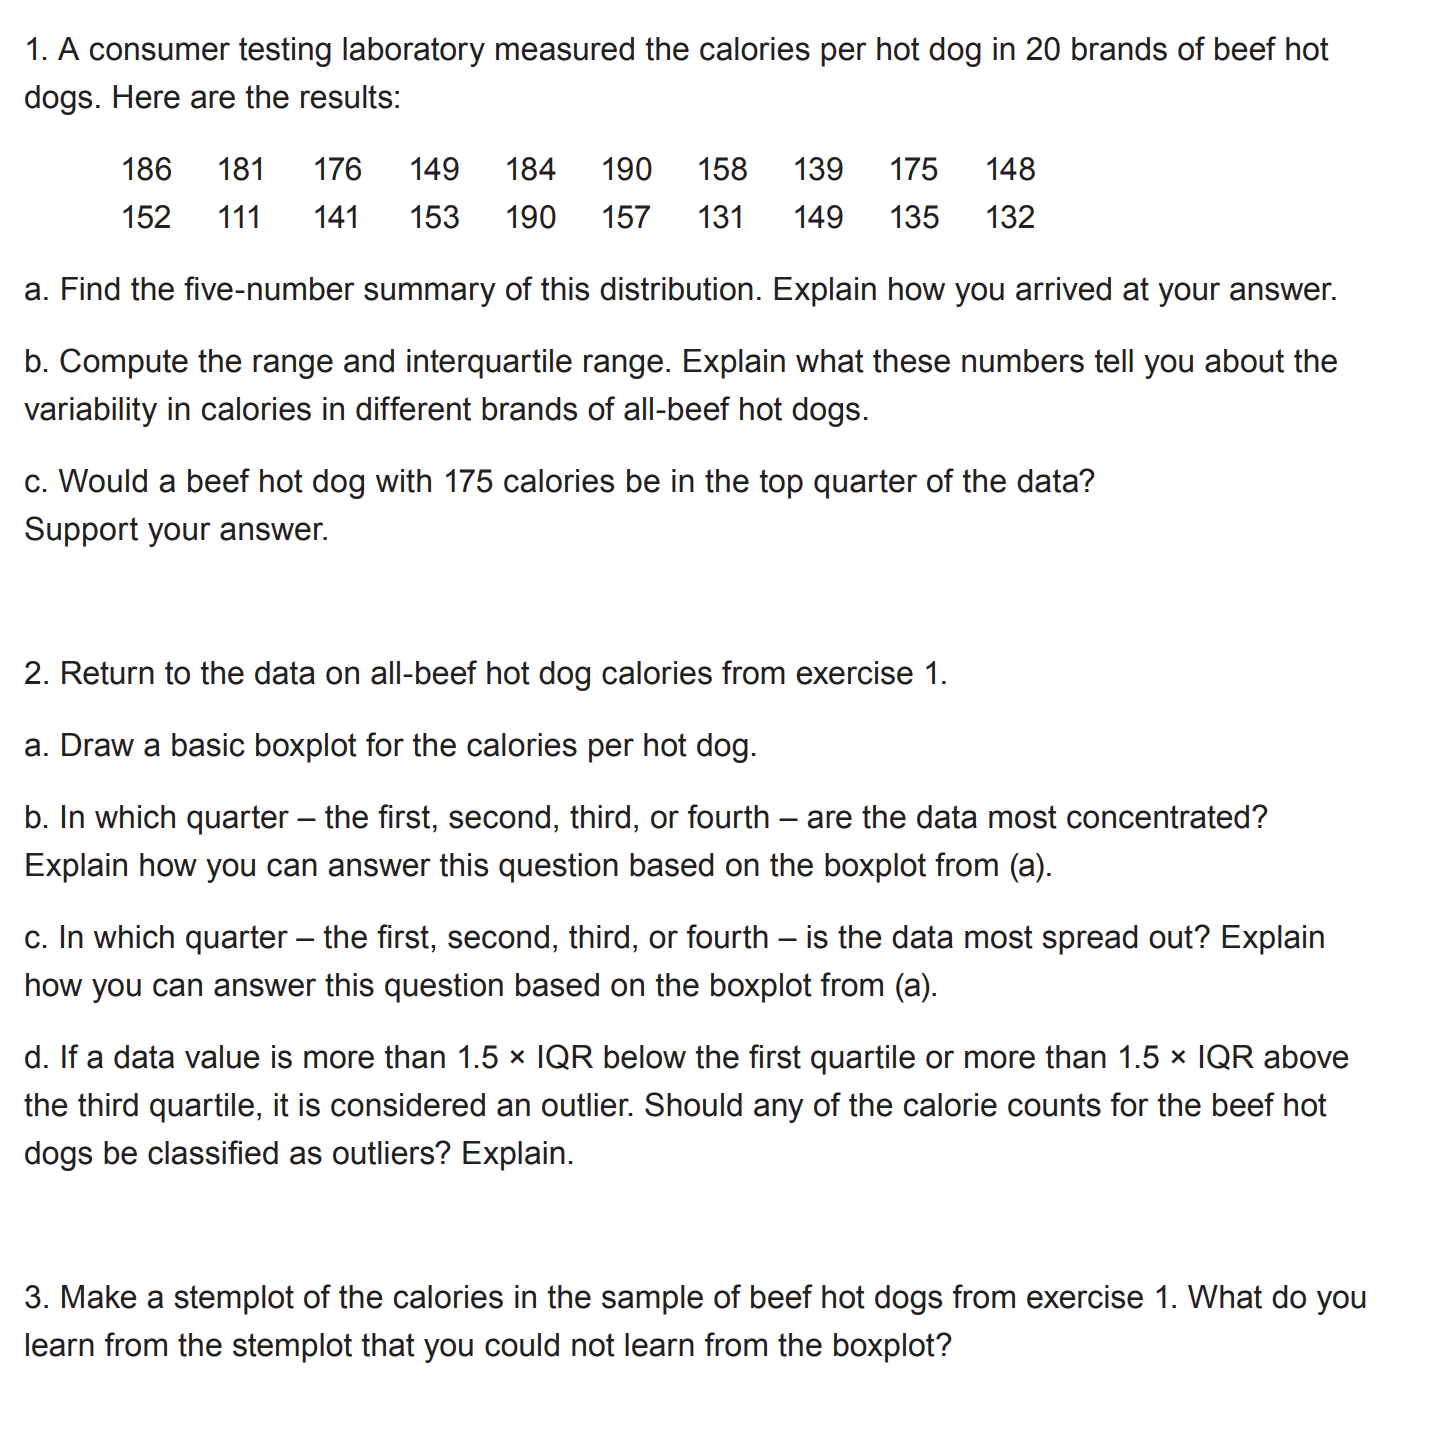
1. A consumer testing laboratory measured the calories per hot dog in 20 brands of beef hot dogs. Here are the results: 186 181 176 149 184 190 158 139 175 148 152 111 141 153 190 157 131 149 135 132 a. Find the ve-number summary of this distribution. Explain how you arrived at your answer. b. Compute the range and interquartile range. Explain what these numbers tell you about the variability in calories in different brands of all-beef hot dogs. c. Would a beef hot dog with 175 calories be in the top quarter of the data? Support your answer. 2. Return to the data on all-beef hot dog calories from exercise 1. 3. Draw a basic boxplot for the calories per hot dog. b. In which quarter the rst, second, third, or fourth are the data most concentrated? Explain how you can answer this question based on the boxplot from (a). c. In which quarter the rst, second, third, or fourth is the data most spread out? Explain how you can answer this question based on the boxplot from (a). d. If a data value is more than 1.5 x IQR below the first quartile or more than 1.5 x IQR above the third quartile, it is considered an outlier. Should any of the calorie counts for the beef hot dogs be classified as outliers? Explain. 3. Make a stemplot of the calories in the sample of beef hot dogs from exercise 1. What do you learn from the stemplot that you could not learn from the boxplot? 4. The calories for 20 brands of veggie dogs are given below. (Notice these data have been ordered from smallest to largest.) 40 45 45 45 5O 50 55 57 60 60 70 80 80 81 90 95 100 100 110 190 a. Make a ve-number summary of the veggie dog calories. b. Make a modied boxplot for the veggie dog data. Use asterisks (*) to indicate any mild outliers and open circles to indicate any extreme outliers. (Leave room to add another graph to this graphic display.) 0. Add a modied boxplot for the beef hot dog calories next to your display in (b). This will allow you to compare the calorie distributions of the two types of hot dogs. d. Based on your displays in (c), compare the distributions of calories for beef dogs and veggie dogs. 5. Refer to the baseball data from Table 3.4, Unit 3. Focus on the variable career home runs. (Keep in mind there are 104 players listed because of ties in career batting averages.) 3. Order the number of career home runs from smallest to largest. (You may want to use software such as Excel or your graphing calculator to do the ordering. Otherwise, try using a stemplot to help you order these data.) b. Create a ve-number summary of the career number of home runs. 0. Make a modied boxplot of the career number of home runs. Mark mild outliers with asterisks (*) and extreme outliers with open circles. Show your calculations for the fences. Write the names of the players above each of the outliers. d. Would you describe the shape of the distribution as symmetric, skewed to the right, or skewed to the left? Justify your choice
Step by Step Solution
There are 3 Steps involved in it
Step: 1
Get Instant Access to Expert-Tailored Solutions
See step-by-step solutions with expert insights and AI powered tools for academic success
Step: 2
Step: 3
Ace Your Homework with AI
Get the answers you need in no time with our AI-driven, step-by-step assistance