

Answered step by step
Verified Expert Solution
Question
1 Approved Answer
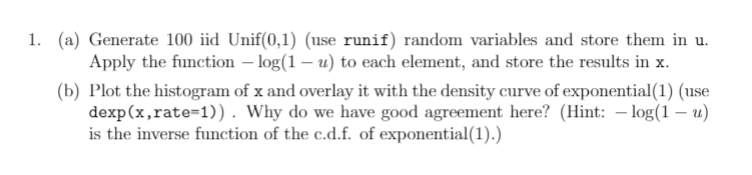
1. (a) Generate 100 iid Unif(0,1) (use runif ) random variables and store them in u. Apply the function - log(1 - u) to each
Step by Step Solution
There are 3 Steps involved in it
Step: 1

Get Instant Access to Expert-Tailored Solutions
See step-by-step solutions with expert insights and AI powered tools for academic success
Step: 2

Step: 3
Ace Your Homework with AI
Get the answers you need in no time with our AI-driven, step-by-step assistance
Get Started
Elementary Algebra
Authors: Charles P McKeague
2nd Edition
1483263819, 9781483263816