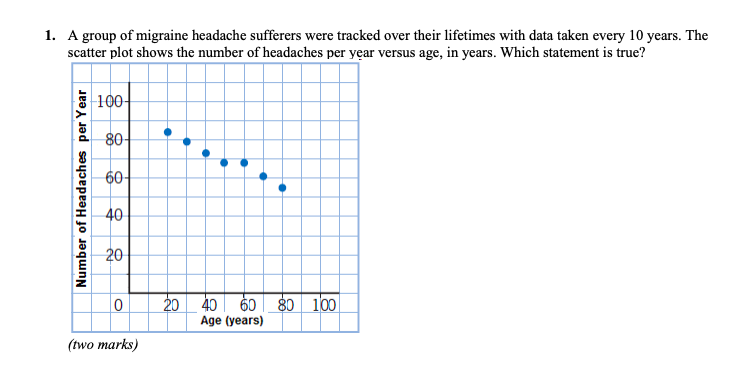
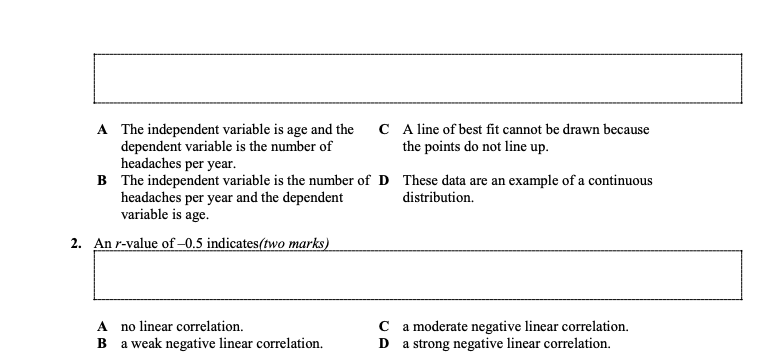
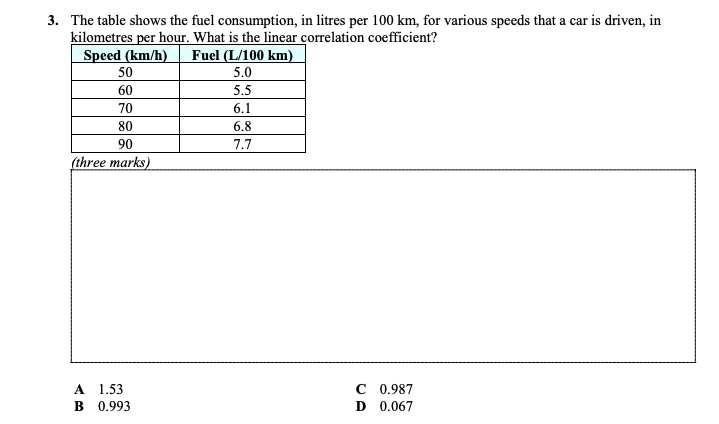
1. A group of migraine headache sufferers were tracked over their lifetimes with data taken every 10 years. The scatter plot shows the number of headaches per year versus age, in years. Which statement is true? 100- 80- 60- Number of Headaches per Year 40 20 0 20 40 60 80 100 Age (years) (two marks)A The independent variable is age and the C A line of best t cannot be drawn because dependent variable is the number of the points do not line up. headaches per year. B The independent variable is the number of I} These data are an example of a continuous headaches per year and the dependent distribution. variable is age. 2. An r-value of 41.5 indicates mrn merits A no linear correlation. C a moderate negative linear correlation. B a weak negative linear correlation. l} a strong negative linear correlation. 3. The table shows the fuel consumption, in litres per 100 km, for various speeds that a car is driven, in kilometres per hour. What is the linear correlation coefficient? Speed (km/h) Fuel (L/100 km) 50 5.0 60 5.5 70 6.1 80 6.8 90 7.7 (three marks) A 1.53 C 0.987 B 0.993 D 0.0674. For a cause and effect relationship between two variables, which statement must be true?(two marks) A The cause must precede the effect. C The effect may occur without the cause taking place. MDM4U Lesson Assignment Page 24. For a cause and effect relationship between two variables, which statement must be true?(two marks) A The cause must precede the effect. C The effect may occur without the cause taking place. MDM4U Lesson Assignment Page 2 B The cause may occur without the effect D All of these are true. taking place. 5. The town of Alphaville finds a positive correlation between the number of traffic wardens hired and the number of parking tickets written. Which conclusion is most likely?(three marks) A Hiring more traffic wardens causes more C A common cause such as increasing people to break the parking rules. population results in more wardens and more parking violations. B The relationship is accidental. D A jump in the number of parking violations has led to the hiring of more traffic wardens.6. Cesare collects fees at the Sunny Beach parking lot. He notices a strong positive correlation between the total parking revenue in late summer and the size of the watermelons being sold at the fruit stand across the street. This is likely(three marks) A an accidental relationship. C a presumed relationship. B a common cause relationship. D a reverse cause and effect relationship. 7. Randy works at the animal shelter. He has noticed a positive correlation between the number of cats available for adoption and the number of visitors to the shelter. This is likely (three marks) A an accidental relationship. C a presumed relationship. B a common cause relationship. D a reverse cause and effect relationship.all. A time series E extrapolation B independent F interpolation C dependent G correlation coefficient D line of best fit H coefficient of determination 1. A measure of how well a linear model fits a two-variable set of data. It can be positive or negative. 2. A set of two-variable data in which a quantity is measured against time. 3. A straight line that represents a trend in the scatter plot as long as the pattern is more or less linear, 4. A variable that is not affected by another variable. 5. A variable that is affected by another variable. 6. A method of determining a value on a linear model between two given data points. 7. A method of determining a value on a linear model beyond given data points.Match the correct term to each of the following descriptions. A term may be used more than once or not at all. A cause and effect relationship D reverse cause and effect relationship B common cause relationship accidental relationship C presumed relationship F relative relationship 8. A relationship that makes sense but does not seem to have a causation factor. MDM4U Lesson Assignment Page 4 9. A relationship that is based purely on coincidence. 10. The correlation between two variables in which a change in one directly causes a change in the other. 11. A relationship in which the independent an dependent variable are reversed. 12. The correlation between two variables in which both variables change as a result of a third common variable