Answered step by step
Verified Expert Solution
Link Copied!

Question

1 Approved Answer

1 A group of occupational hygienists wanted to estimate the level of our dust in Norwegian bakeries. The following data (mg/m3) represents measurements from 16
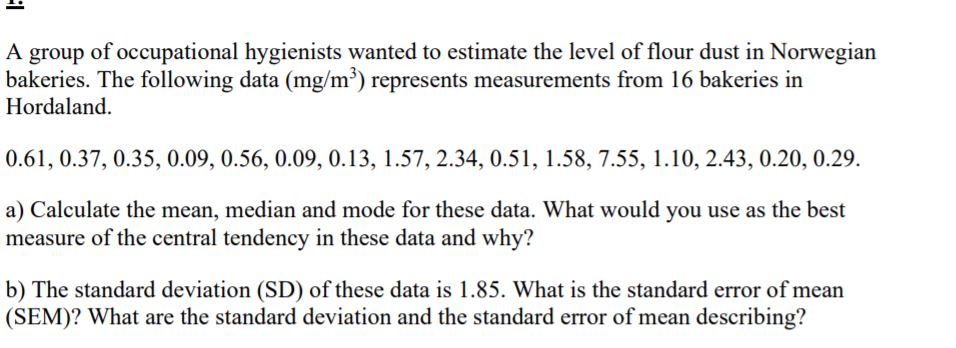
image text in transcribed
1 A group of occupational hygienists wanted to estimate the level of our dust in Norwegian bakeries. The following data (mg/m3) represents measurements from 16 bakeries in Hordaland. 0.61, 0.32, 0.35, 0.09, 0.56, 0.09, 0.13, 1.57, 2.34, 0.51, 1.58, 155, 1.10, 2.43, 0.20, 0.29. a) Calculate the mean, median and mode for these data. What would you use as the best measure of the central tendency in these data and why? b) The standard deviation (SD) of these data is 1.85. What is the standard error of mean (SEM)? What are the standard deviation and the standard error of mean describing

Step by Step Solution

There are 3 Steps involved in it

Step: 1

blur-text-image

Get Instant Access to Expert-Tailored Solutions

See step-by-step solutions with expert insights and AI powered tools for academic success

Step: 2

blur-text-image

Step: 3

blur-text-image

Ace Your Homework with AI

Get the answers you need in no time with our AI-driven, step-by-step assistance

Get Started

Recommended Textbook for

An Introduction to the Mathematics of financial Derivatives

Authors: Salih N. Neftci

2nd Edition

978-0125153928, 9780080478647, 125153929, 978-0123846822

More Books

Students also viewed these Mathematics questions

Question

=+How might you explain this phenomenon?

Answered: 1 week ago