Answered step by step
Verified Expert Solution
Question
1 Approved Answer
1. A large ride-sharing company is examining data on passengers' drive times to airports, to improve its algorithm for matching riders with nearby drivers. The
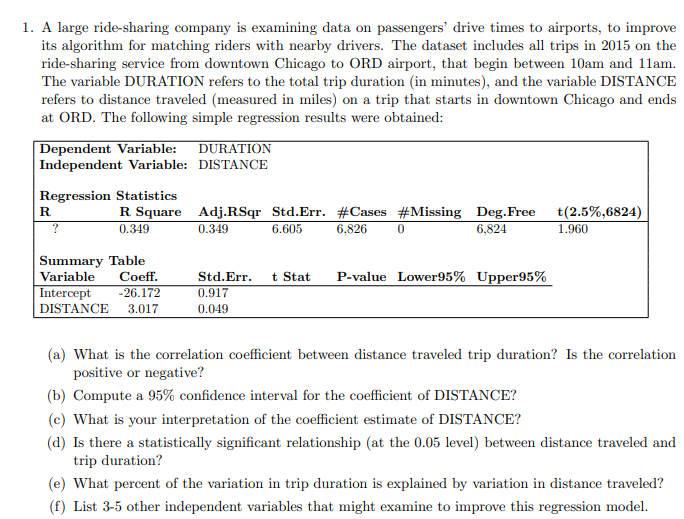
1. A large ride-sharing company is examining data on passengers' drive times to airports, to improve its algorithm for matching riders with nearby drivers. The dataset includes all trips in 2015 on the ride-sharing service from downtown Chicago to ORD airport, that begin between 10am and 1lam. The variable DURATION refers to the total trip duration (in minutes), and the variable DISTANCE refers to distance traveled (measured in miles) on a trip that starts in downtown Chicago and ends at ORD. The following simple regression results were obtained: Dependent Variable: DURATION Independent Variable: DISTANCE Regression Statistics R R Square Adj.RSqr Std.Err. #Cases #Missing Deg.Free t(2.5%,6824) 0.349 0.349 6.605 6.826 0 6,824 1.960 Summary Table Variable Coeff. Std.Err. t Stat P-value Lower95% Upper95% Intercept -26.172 0.917 DISTANCE 3.017 0.049 (a) What is the correlation coefficient between distance traveled trip duration? Is the correlation positive or negative? (b) Compute a 95% confidence interval for the coefficient of DISTANCE? (c) What is your interpretation of the coefficient estimate of DISTANCE? (d) Is there a statistically significant relationship (at the 0.05 level) between distance traveled and trip duration? (e) What percent of the variation in trip duration is explained by variation in distance traveled? (f) List 3-5 other independent variables that might examine to improve this regression model
Step by Step Solution
There are 3 Steps involved in it
Step: 1
Get Instant Access to Expert-Tailored Solutions
See step-by-step solutions with expert insights and AI powered tools for academic success
Step: 2
Step: 3
Ace Your Homework with AI
Get the answers you need in no time with our AI-driven, step-by-step assistance
Get Started