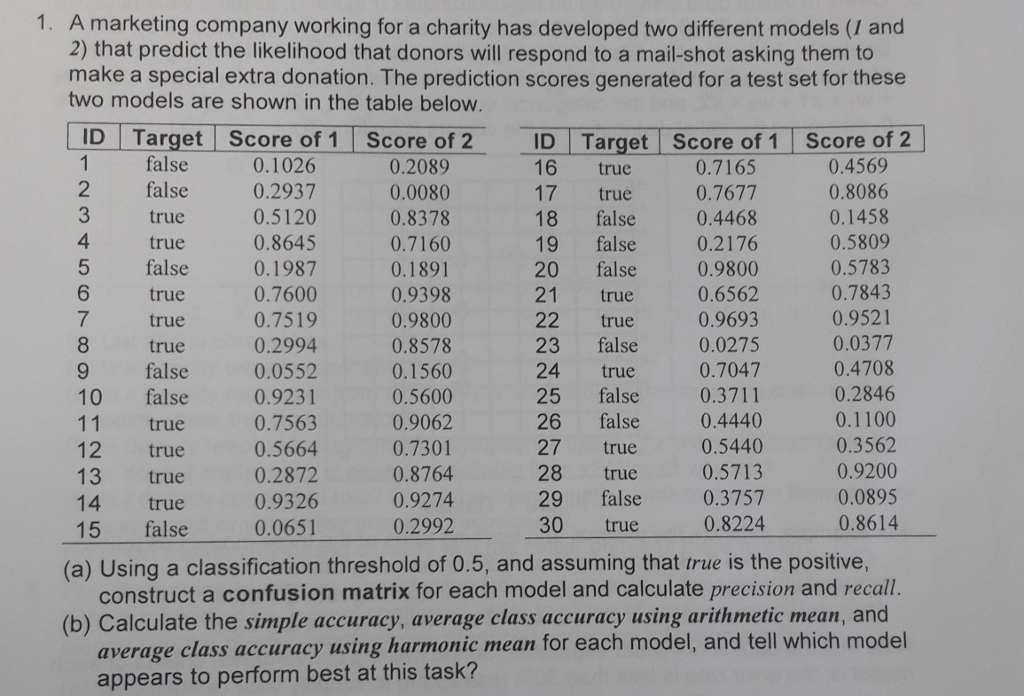
1. A marketing company working for a charity has developed two different models (I and 2) that predict the likelihood that donors will respond to a mail-shot asking them to make a special extra donation. The prediction scores generated for a test set for these two models are shown in the table below. ID Target Score of 1 Score of 2 1 2 false 0.2937 3 4 5 ID Target Score of 1 Score of 2 16 true 17 true 0.7677 18 false 0.4468 19 false 0.2176 20 false 21 true 22 true0.9693 23 false false 0.1026 0.2089 0.0080 0.8378 0.7160 0.1891 0.9398 0.9800 0.8578 0.1560 0.5600 0.9062 0.7301 0.8764 0.9274 0.2992 0.4569 0.8086 0.1458 0.5809 0.5783 0.7843 0.9521 0.0377 0.4708 0.2846 0.1100 0.3562 0.9200 0.0895 0.7165 true true false true true true 0.5120 0.8645 0.1987 0.7600 0.7519 0.2994 0.9800 0.6562 0.0275 0.7047 9 false 0.0552 10 false 0.9231 11 true true 0.7563 0.5664 0.2872 0.9326 25 false 0.3711 26 false 0.4440 27 true 28 true 29 false 0.3757 30 true 0.5440 0.5713 true 13 true 14 true 0.8224 (a) Using a classification threshold of 0.5, and assuming that true is the positive, construct a confusion matrix for each model and calculate precision and recall. (b) Calculate the simple accuracy, average class accuracy using arithmetic mean, and average class accuracy using harmonic mean for each model, and tell which model appears to perform best at this task? 1. A marketing company working for a charity has developed two different models (I and 2) that predict the likelihood that donors will respond to a mail-shot asking them to make a special extra donation. The prediction scores generated for a test set for these two models are shown in the table below. ID Target Score of 1 Score of 2 1 2 false 0.2937 3 4 5 ID Target Score of 1 Score of 2 16 true 17 true 0.7677 18 false 0.4468 19 false 0.2176 20 false 21 true 22 true0.9693 23 false false 0.1026 0.2089 0.0080 0.8378 0.7160 0.1891 0.9398 0.9800 0.8578 0.1560 0.5600 0.9062 0.7301 0.8764 0.9274 0.2992 0.4569 0.8086 0.1458 0.5809 0.5783 0.7843 0.9521 0.0377 0.4708 0.2846 0.1100 0.3562 0.9200 0.0895 0.7165 true true false true true true 0.5120 0.8645 0.1987 0.7600 0.7519 0.2994 0.9800 0.6562 0.0275 0.7047 9 false 0.0552 10 false 0.9231 11 true true 0.7563 0.5664 0.2872 0.9326 25 false 0.3711 26 false 0.4440 27 true 28 true 29 false 0.3757 30 true 0.5440 0.5713 true 13 true 14 true 0.8224 (a) Using a classification threshold of 0.5, and assuming that true is the positive, construct a confusion matrix for each model and calculate precision and recall. (b) Calculate the simple accuracy, average class accuracy using arithmetic mean, and average class accuracy using harmonic mean for each model, and tell which model appears to perform best at this task