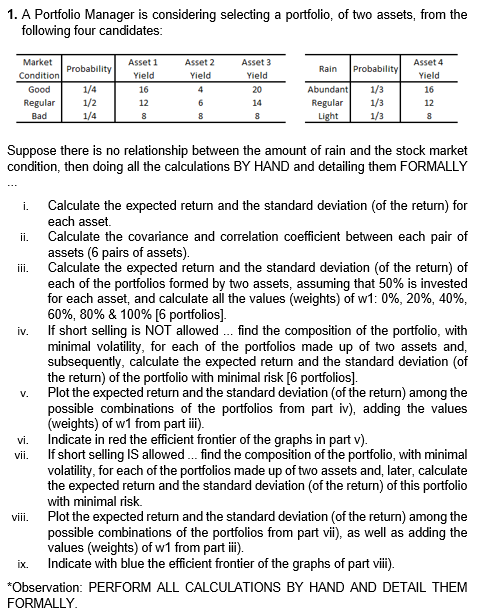
1. A Portfolio Manager is considering selecting a portfolio of two assets, from the following four candidates: Probability Asset 2 Yield Rain Probability Market Condition Good Regular Bad 1/4 1/2 Asset 1 Yield 16 12 8 Asset 3 Yield 20 14 8 Abundant Regular Light 6 8 Asset 4 Yield 16 12 8 1/3 1/3 1/3 1/4 Suppose there is no relationship between the amount of rain and the stock market condition, then doing all the calculations BY HAND and detailing them FORMALLY i. ii. iii. iv. V. Calculate the expected return and the standard deviation of the return) for each asset. Calculate the covariance and correlation coefficient between each pair of assets (6 pairs of assets). Calculate the expected return and the standard deviation of the return) of each of the portfolios formed by two assets, assuming that 50% is invested for each asset, and calculate all the values (weights) of w1: 0%, 20%, 40%, 60%, 80% & 100% [6 portfolios). If short selling is NOT allowed ... find the composition of the portfolio, with minimal volatility, for each of the portfolios made up of two assets and, subsequently, calculate the expected return and the standard deviation of the return) of the portfolio with minimal risk [6 portfolios). Plot the expected return and the standard deviation of the return) among the possible combinations of the portfolios from part iv), adding the values (weights) of w1 from part ii). vi. Indicate in red the efficient frontier of the graphs in part v). If short selling IS allowed ... find the composition of the portfolio, with minimal volatility, for each of the portfolios made up of two assets and later, calculate the expected return and the standard deviation of the return) of this portfolio with minimal risk. viii. Plot the expected return and the standard deviation (of the return) among the possible combinations of the portfolios from part vii), as well as adding the values (weights) of w1 from part ii). ix. Indicate with blue the efficient frontier of the graphs of part viii). *Observation: PERFORM ALL CALCULATIONS BY HAND AND DETAIL THEM FORMALLY. vii. 1. A Portfolio Manager is considering selecting a portfolio of two assets, from the following four candidates: Probability Asset 2 Yield Rain Probability Market Condition Good Regular Bad 1/4 1/2 Asset 1 Yield 16 12 8 Asset 3 Yield 20 14 8 Abundant Regular Light 6 8 Asset 4 Yield 16 12 8 1/3 1/3 1/3 1/4 Suppose there is no relationship between the amount of rain and the stock market condition, then doing all the calculations BY HAND and detailing them FORMALLY i. ii. iii. iv. V. Calculate the expected return and the standard deviation of the return) for each asset. Calculate the covariance and correlation coefficient between each pair of assets (6 pairs of assets). Calculate the expected return and the standard deviation of the return) of each of the portfolios formed by two assets, assuming that 50% is invested for each asset, and calculate all the values (weights) of w1: 0%, 20%, 40%, 60%, 80% & 100% [6 portfolios). If short selling is NOT allowed ... find the composition of the portfolio, with minimal volatility, for each of the portfolios made up of two assets and, subsequently, calculate the expected return and the standard deviation of the return) of the portfolio with minimal risk [6 portfolios). Plot the expected return and the standard deviation of the return) among the possible combinations of the portfolios from part iv), adding the values (weights) of w1 from part ii). vi. Indicate in red the efficient frontier of the graphs in part v). If short selling IS allowed ... find the composition of the portfolio, with minimal volatility, for each of the portfolios made up of two assets and later, calculate the expected return and the standard deviation of the return) of this portfolio with minimal risk. viii. Plot the expected return and the standard deviation (of the return) among the possible combinations of the portfolios from part vii), as well as adding the values (weights) of w1 from part ii). ix. Indicate with blue the efficient frontier of the graphs of part viii). *Observation: PERFORM ALL CALCULATIONS BY HAND AND DETAIL THEM FORMALLY. vii