Answered step by step
Verified Expert Solution
Link Copied!

Question

1 Approved Answer

1. A researcher collects data on the number of hours that 10 student reported that they spent studying for a test and the number of
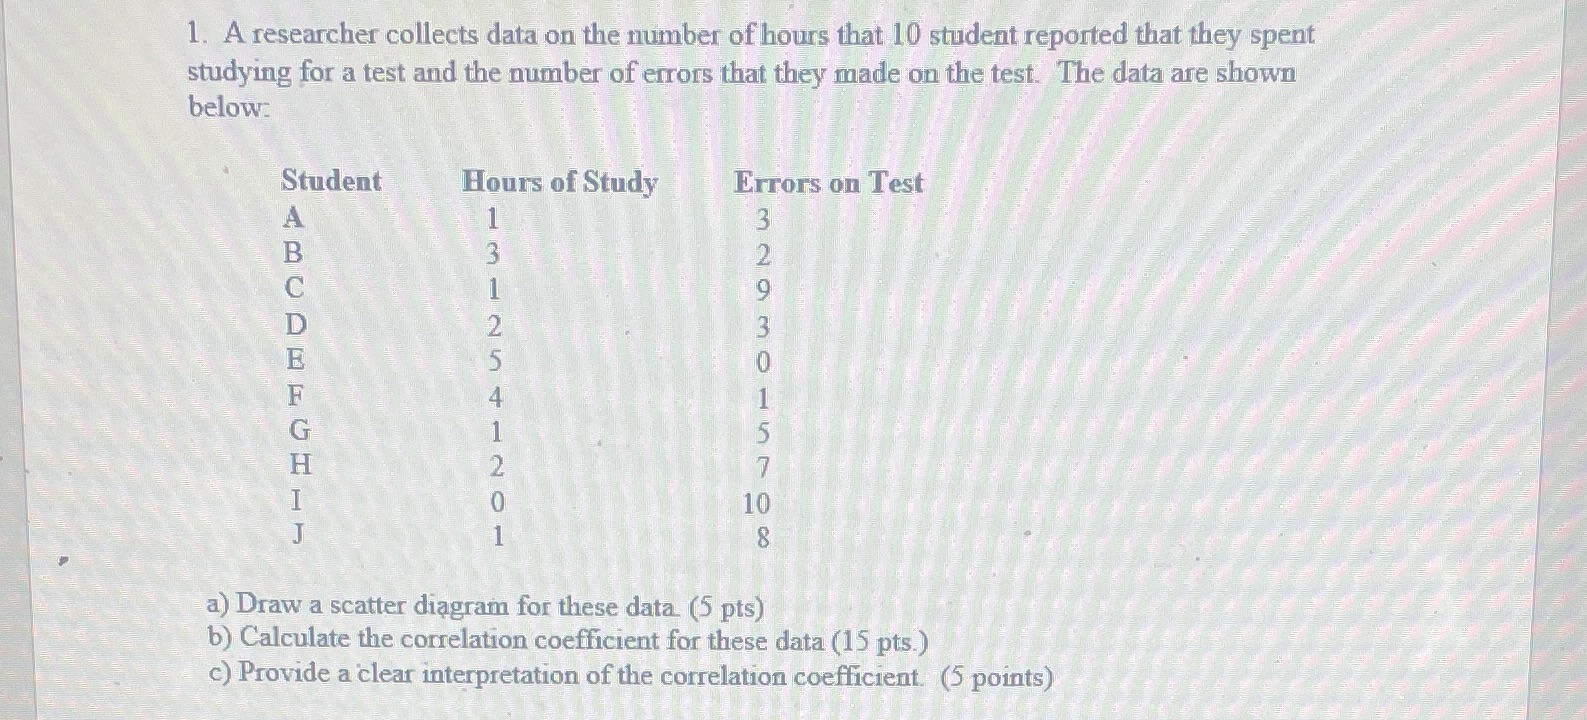
image text in transcribed
1. A researcher collects data on the number of hours that 10 student reported that they spent studying for a test and the number of errors that they made on the test. The data are shown below: Student Hours of Study Errors on Test a) Draw a scatter diagram for these data. (5 pts) b) Calculate the correlation coefficient for these data (15 pts.) c) Provide a clear interpretation of the correlation coefficient. (5 points)

Step by Step Solution

There are 3 Steps involved in it

Step: 1

blur-text-image

Get Instant Access to Expert-Tailored Solutions

See step-by-step solutions with expert insights and AI powered tools for academic success

Step: 2

blur-text-image_2

Step: 3

blur-text-image_3

Ace Your Homework with AI

Get the answers you need in no time with our AI-driven, step-by-step assistance

Get Started

Recommended Textbook for

Calculus I With Integrated Precalculus

Authors: Laura Taalman

1st Edition

1464153027, 9781464153020

More Books

Students also viewed these Mathematics questions

Question

Challenges Facing Todays Organizations?

Answered: 1 week ago