

Question: 1. (a) Show how a missing variable might explain why the slope of the simple estimated CAPM is steeper than the theoretical CAPM would suggest.
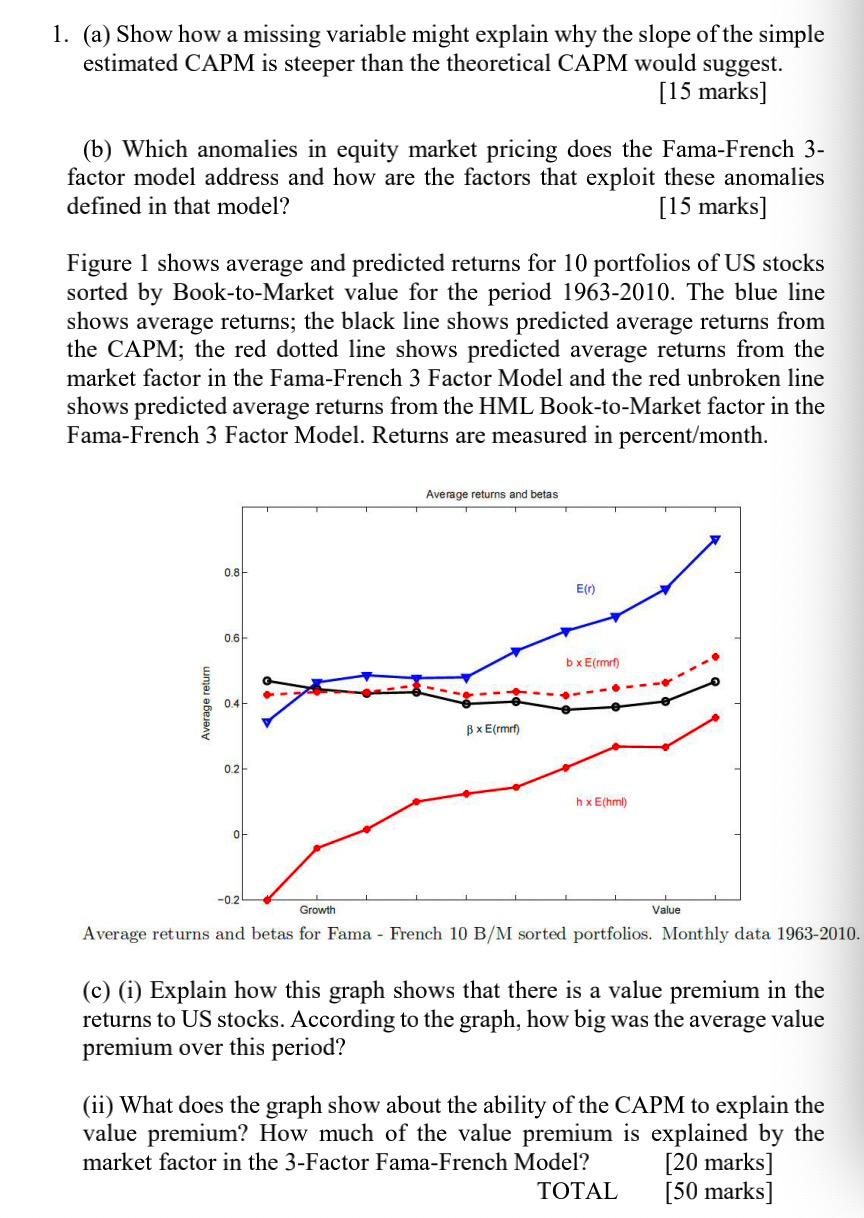
1. (a) Show how a missing variable might explain why the slope of the simple estimated CAPM is steeper than the theoretical CAPM would suggest. [15 marks] (b) Which anomalies in equity market pricing does the Fama-French 3- factor model address and how are the factors that exploit these anomalies defined in that model? [15 marks] Figure 1 shows average and predicted returns for 10 portfolios of US stocks sorted by Book-to-Market value for the period 1963-2010. The blue line shows average returns; the black line shows predicted average returns from the CAPM; the red dotted line shows predicted average returns from the market factor in the Fama-French 3 Factor Model and the red unbroken line shows predicted average returns from the HML Book-to-Market factor in the Fama-French 3 Factor Model. Returns are measured in percent/month. Average returns and betas 0.8 0.6 0.4 Average return 0.2 B xE(rmrf) hx E(hml) -0.2 Growth Value Average returns and betas for Fama - French 10 B/M sorted portfolios. Monthly data 1963-2010. (c) (i) Explain how this graph shows that there is a value premium in the returns to US stocks. According to the graph, how big was the average value premium over this period? (ii) What does the graph show about the ability of the CAPM to explain the value premium? How much of the value premium is explained by the market factor in the 3-Factor Fama-French Model? [20 marks] [50 marks] TOTAL E(r) bx E(rmrf) of 1. (a) Show how a missing variable might explain why the slope of the simple estimated CAPM is steeper than the theoretical CAPM would suggest. [15 marks] (b) Which anomalies in equity market pricing does the Fama-French 3- factor model address and how are the factors that exploit these anomalies defined in that model? [15 marks] Figure 1 shows average and predicted returns for 10 portfolios of US stocks sorted by Book-to-Market value for the period 1963-2010. The blue line shows average returns; the black line shows predicted average returns from the CAPM; the red dotted line shows predicted average returns from the market factor in the Fama-French 3 Factor Model and the red unbroken line shows predicted average returns from the HML Book-to-Market factor in the Fama-French 3 Factor Model. Returns are measured in percent/month. Average returns and betas 0.8 0.6 0.4 Average return 0.2 B xE(rmrf) hx E(hml) -0.2 Growth Value Average returns and betas for Fama - French 10 B/M sorted portfolios. Monthly data 1963-2010. (c) (i) Explain how this graph shows that there is a value premium in the returns to US stocks. According to the graph, how big was the average value premium over this period? (ii) What does the graph show about the ability of the CAPM to explain the value premium? How much of the value premium is explained by the market factor in the 3-Factor Fama-French Model? [20 marks] [50 marks] TOTAL E(r) bx E(rmrf) of
Step by Step Solution
There are 3 Steps involved in it

Get step-by-step solutions from verified subject matter experts