

Question
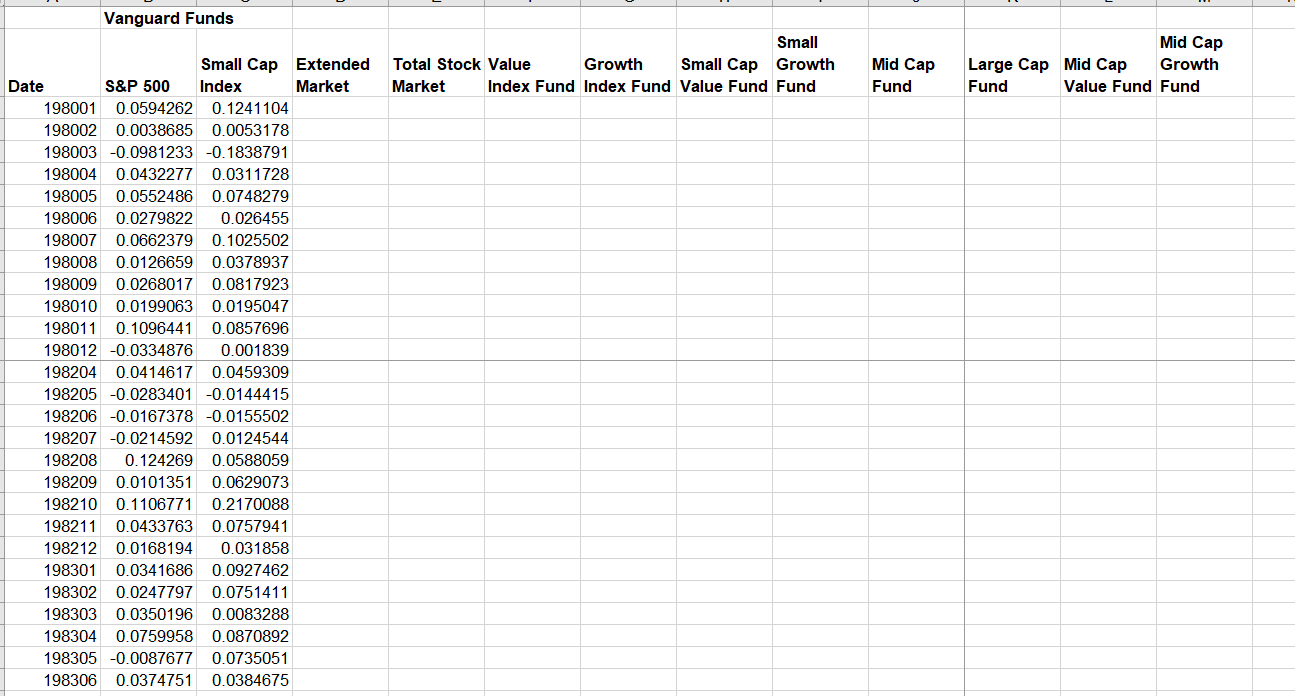
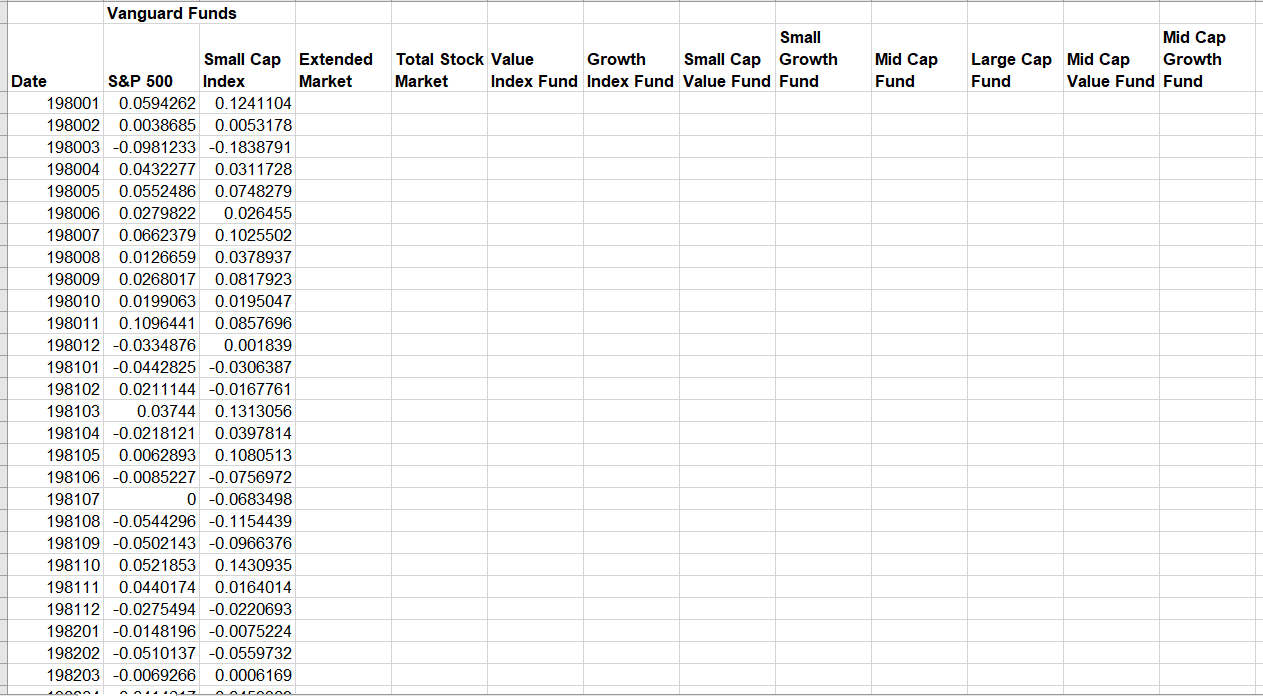
1 a) What is the problem of comparing these numbers between funds? b) How might you correct it? what new problem does this create? See
1 a) What is the problem of comparing these numbers between funds? b) How might you correct it? what new problem does this create?
See Vanguard Fund picture below. Data set is large so only a portion of data is shown.
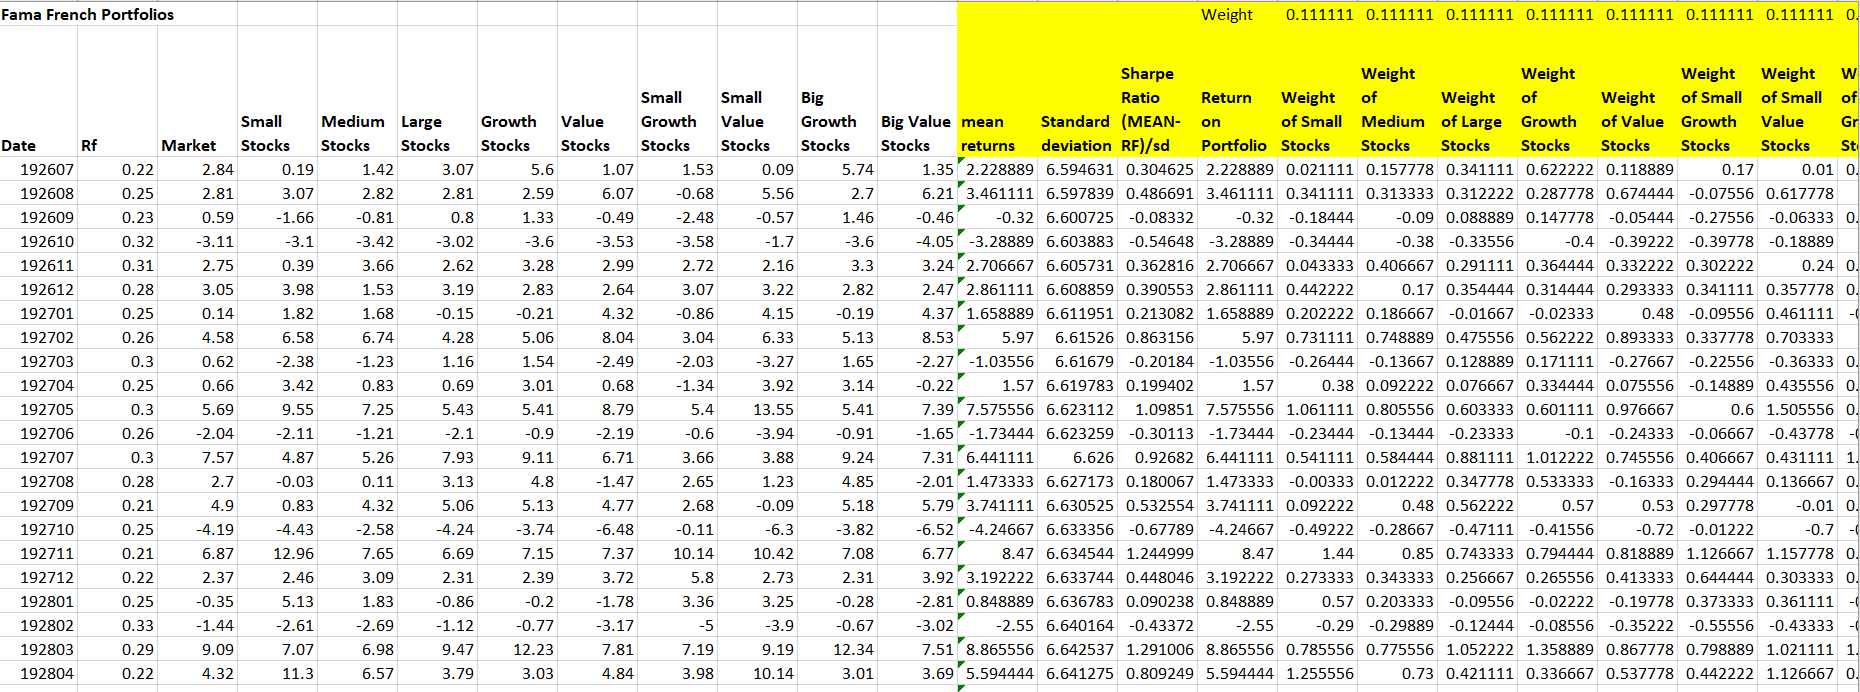
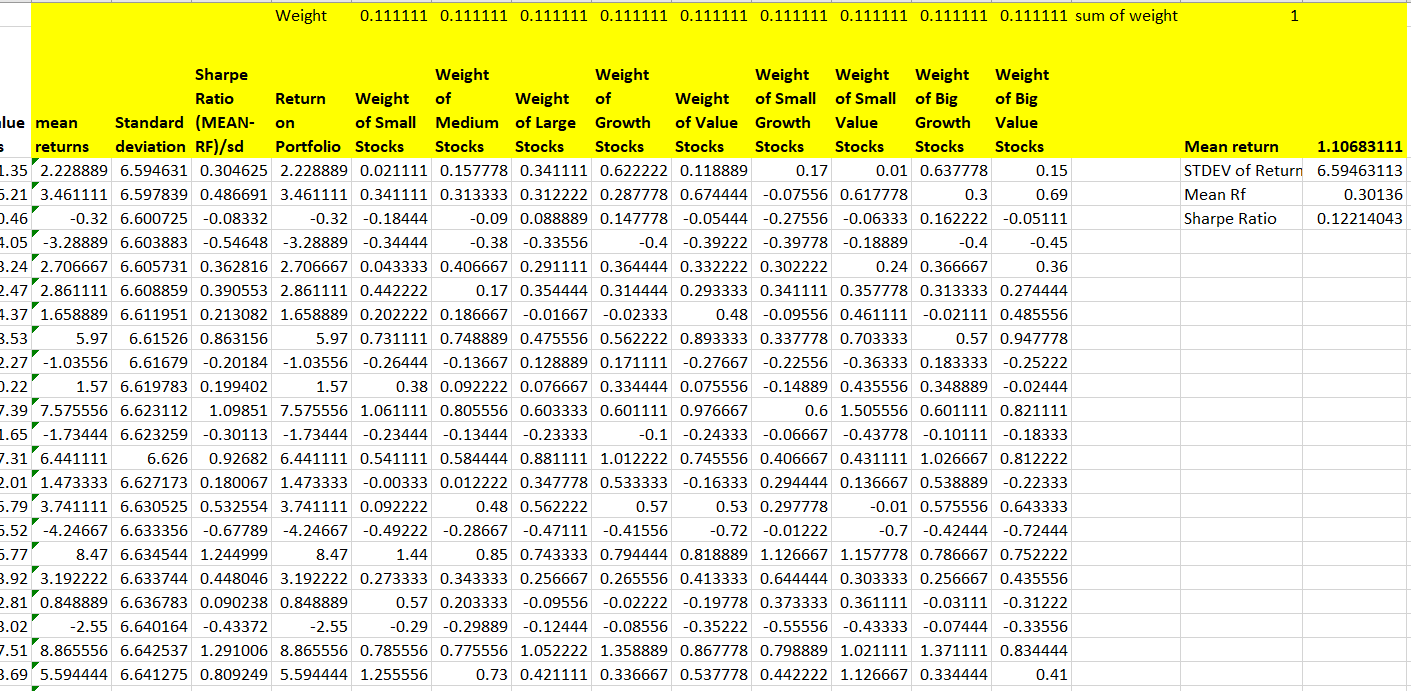
2. What are the mean return, SD of returns and Sharpe ratios for each of portfolios? See Fama French Porfolio Returns here (a portion of the data is shown, the data amount is large). I have also shown my work as shown in under the yellow boxes, not sure if they are correct. Can you check if they are correct? Thank you.
| 10. Assume (for simplification purposes) that the present value of your retirement savings is a lump sum of $100,000 that you will invest for 30 years. How much higher is your expected payoff in 30 years time as a result of this exercise, relative to the two benchmark cases above? \begin{tabular}{|c|c|c|c|c|c|c|c|c|c|c|c|c|} \hline \multirow[b]{2}{*}{ Date } & \multicolumn{2}{|c|}{ Vanguard Funds } & \multirow[b]{2}{*}{\begin{tabular}{l} Extended \\ Market \end{tabular}} & \multirow[b]{2}{*}{\begin{tabular}{l} Total Stock \\ Market \end{tabular}} & \multirow[b]{2}{*}{\begin{tabular}{l} Value \\ Index Fund \end{tabular}} & \multirow[b]{2}{*}{\begin{tabular}{l} Growth \\ Index Fund \end{tabular}} & \multirow[b]{2}{*}{\begin{tabular}{l} Small Cap \\ Value Fund \end{tabular}} & \multirow[b]{2}{*}{\begin{tabular}{l} Small \\ Growth \\ Fund \end{tabular}} & \multirow[b]{2}{*}{\begin{tabular}{l} Mid Cap \\ Fund \end{tabular}} & \multirow[b]{2}{*}{\begin{tabular}{l} Large Cap \\ Fund \end{tabular}} & \multirow[b]{2}{*}{\begin{tabular}{l} Mid Cap \\ Value Fund \end{tabular}} & \multirow[b]{2}{*}{\begin{tabular}{l} Mid Cap \\ Growth \\ Fund \end{tabular}} \\ \hline & S\&P 500 & \begin{tabular}{l} Small Cap \\ Index \end{tabular} & & & & & & & & & & \\ \hline 198001 & 0.0594262 & 0.1241104 & & & & & & & & & & \\ \hline 198002 & 0.0038685 & 0.0053178 & & & & & & & & & & \\ \hline 198003 & -0.0981233 & -0.1838791 & & & & & & & & & & \\ \hline 198004 & 0.0432277 & 0.0311728 & & & & & & & & & & \\ \hline 198005 & 0.0552486 & 0.0748279 & & & & & & & & & & \\ \hline 198007 & 0.0662379 & 0.1025502 & & & & & & & & & & \\ \hline 198008 & 0.0126659 & 0.0378937 & & & & & & & & & & \\ \hline 198009 & 0.0268017 & 0.0817923 & & & & & & & & & & \\ \hline 198010 & 0.0199063 & 0.0195047 & & & & & & & & & & \\ \hline 198011 & 0.1096441 & 0.0857696 & & & & & & & & & & \\ \hline 198012 & -0.0334876 & 0.001839 & & & & & & & & & & \\ \hline 198204 & 0.0414617 & 0.0459309 & & & & & & & & & & \\ \hline 198205 & -0.0283401 & -0.0144415 & & & & & & & & & & \\ \hline 198206 & -0.0167378 & -0.0155502 & & & & & & & & & & \\ \hline 198208 & 0.124269 & 0.0588059 & & & & & & & & & & \\ \hline 198209 & 0.0101351 & 0.0629073 & & & & & & & & & & \\ \hline 198210 & 0.1106771 & 0.2170088 & & & & & & & & & & \\ \hline 198211 & 0.0433763 & 0.0757941 & & & & & & & & & & \\ \hline 198212 & 0.0168194 & 0.031858 & & & & & & & & & & \\ \hline 198301 & 0.0341686 & 0.0927462 & & & & & & & & & & \\ \hline 198302 & 0.0247797 & 0.0751411 & & & & & & & & & & \\ \hline 198303 & 0.0350196 & 0.0083288 & & & & & & & & & & \\ \hline 198304 & 0.0759958 & 0.0870892 & & & & & & & & & & \\ \hline 198305 & -0.0087677 & 0.0735051 & & & & & & & & & & \\ \hline 198306 & 0.0374751 & 0.0384675 & & & & & & & & & & \\ \hline \end{tabular} you attempt to determine what expected return on UK stocks you should at least have to improve your Sharpe ratio. What is the hurdle rate? Show your reasoning and computations. d) Compute a similar hurdle rate for the Japanese equity market. Are the differences between your answers to c ) and d) surprising? Why or why not? e) Suppose you are allowed to put a small proportion of your portfolio in either Japan or the UK, but not in both. Which country would you pick? Why? Q.2. Consider the following data for the US and Australia: Correlation of US-AU =0.80 Assume the risk-free rate to be 7%. a) Compute the weights for the minimum variance portfolio (MVP). b) Compute the weights for the mean variance efficient (MVE) portfolio. c) What is the slope of the Capital Allocation Line (CAL)? Part 2- Data You sign up to your employer's retirement plan, and are presented with a range of retirement plans from different vendors. The choice looks bewildering, but you resist the urge to simply pick at random. Based on your knowledge of investments, you are fairly sure of the following facts: a) Stocks have historically outperformed bonds in the long run. b) Actively managed mutual funds tend to underperform. Few funds consistently beat a broad market index before expenses, and even fewer beat index funds after expenses. c) Since retirement is a long time away, you want to take on a higher risk higher return portfolio. Based on the above, you lean towards investing in Index funds. Since you seem to recall that Vanguard is one of the low cost index fund providers, you download the returns from Vanguard's funds. You decide to first compare the funds summary statistics to get a sense of how they perform. 1. a) Open up the Vanguard Fund Returns File. What is the problem of comparing these numbers between funds? b) How might you correct it? What new problem does this create? The data look hopeless. You are about to give up, but suddenly you have a flash of inspiration - since these are Index funds we don't need to use the Vanguard returns directly. Instead, we can approximate them with returns on a type of index that they are trying to mimic! Since these are standard portfolios, you go to Ken French's website and download returns on standard portfolios for the overall market, and for portfolios sorted on size and book-to-market rations. Now you have more data than you could ever want! 2. Open up the Fama French Portfolio Returns File (which you'll use for the rest of the questions). What are the mean return, standard deviation of returns and Sharpe ratios for each of the portfolios? You decide to first consider a portfolio that equally weights all US equity portfolios. Note that while there is some overlap in which stocks each portfolio covers (e.g. the market covers all stocks, Small Value is a subset of Value, etc.) this is designed to replicate the fact that the actual Vanguard funds exhibit similar overlap. Hence you should use all the equity portfolios (i.e. everything except the risk free rate). IMPORTANT: To compute a standard deviation for a portfolio of many stocks, the easiest way is to first compute the portfolio returns at each date, and then compute the standard deviation of the resulting time series of returns. So for each date, if you have assets A, B, C etc. first use excel to compute separately for each date: Ri,t=wARA,t+wBRB,t+wCRC,t Then, once you've used this to compute the returns to the portfolio for a given set of weights, you can treat the resulting returns as a single asset, and just take the standard deviation of returns like you did for the single asset case before. 3. What are the mean return, standard deviation of returns and Sharpe ratios for the equally weighted US equity portfolio? When you look at this portfolio, the equal weighting seems rather arbitrary. You recall from the CAPM that the optimal portfolio is the tangency portfolio, and that this is the portfolio that maximizes the Sharpe ratio when both weights must sum to 1 . \begin{tabular}{|c|c|c|c|c|c|c|c|c|c|c|c|c|} \hline \multirow[b]{2}{*}{ Date } & \multicolumn{2}{|c|}{ Vanguard Funds } & \multirow[b]{2}{*}{\begin{tabular}{l} Extended \\ Market \end{tabular}} & \multirow[b]{2}{*}{\begin{tabular}{l} Total Stock \\ Market \end{tabular}} & \multirow[b]{2}{*}{\begin{tabular}{l} Value \\ Index Fund \end{tabular}} & \multirow[b]{2}{*}{\begin{tabular}{l} Growth \\ Index Fund \end{tabular}} & \multirow[b]{2}{*}{\begin{tabular}{l} Small Cap \\ Value Fund \end{tabular}} & \multirow[b]{2}{*}{\begin{tabular}{l} Small \\ Growth \\ Fund \end{tabular}} & \multirow[b]{2}{*}{\begin{tabular}{l} Mid Cap \\ Fund \end{tabular}} & \multirow[b]{2}{*}{\begin{tabular}{l} Large Cap \\ Fund \end{tabular}} & \multirow[b]{2}{*}{\begin{tabular}{l} Mid Cap \\ Value Fund \end{tabular}} & \multirow[b]{2}{*}{\begin{tabular}{l} Mid Cap \\ Growth \\ Fund \end{tabular}} \\ \hline & S\&P 500 & \begin{tabular}{l} Small Cap \\ Index \end{tabular} & & & & & & & & & & \\ \hline 198001 & 0.0594262 & 0.1241104 & & & & & & & & & & \\ \hline 198002 & 0.0038685 & 0.0053178 & & & & & & & & & & \\ \hline 198003 & -0.0981233 & -0.1838791 & & & & & & & & & & \\ \hline 198004 & 0.0432277 & 0.0311728 & & & & & & & & & & \\ \hline 198005 & 0.0552486 & 0.0748279 & & & & & & & & & & \\ \hline 198006 & 0.0279822 & 0.026455 & & & & & & & & & & \\ \hline 198007 & 0.0662379 & 0.1025502 & & & & & & & & & & \\ \hline 198008 & 0.0126659 & 0.0378937 & & & & & & & & & & \\ \hline 198009 & 0.0268017 & 0.0817923 & & & & & & & & & & \\ \hline 198010 & 0.0199063 & 0.0195047 & & & & & & & & & & \\ \hline 198011 & 0.1096441 & 0.0857696 & & & & & & & & & & \\ \hline 198012 & -0.0334876 & 0.001839 & & & & & & & & & & \\ \hline 198101 & -0.0442825 & -0.0306387 & & & & & & & & & & \\ \hline 198102 & 0.0211144 & -0.0167761 & & & & & & & & & & \\ \hline 198103 & 0.03744 & 0.1313056 & & & & & & & & & & \\ \hline 198104 & -0.0218121 & 0.0397814 & & & & & & & & & & \\ \hline 198105 & 0.0062893 & 0.1080513 & & & & & & & & & & \\ \hline 198106 & -0.0085227 & -0.0756972 & & & & & & & & & & \\ \hline 198107 & 0 & -0.0683498 & & & & & & & & & & \\ \hline 198108 & -0.0544296 & -0.1154439 & & & & & & & & & & \\ \hline 198109 & -0.0502143 & -0.0966376 & & & & & & & & & & \\ \hline 198110 & 0.0521853 & 0.1430935 & & & & & & & & & & \\ \hline 198111 & 0.0440174 & 0.0164014 & & & & & & & & & & \\ \hline 198112 & -0.0275494 & -0.0220693 & & & & & & & & & & \\ \hline 198201 & -0.0148196 & -0.0075224 & & & & & & & & & & \\ \hline 198202 & -0.0510137 & -0.0559732 & & & & & & & & & & \\ \hline 198203 & -0.0069266 & 0.0006169 & & & & & & & & & & \\ \hline \end{tabular} 4. Calculate the tangency portfolio for all US equity indices. What do you think of these weights? When you look at the tangency weights, you realize that some of them are negative. This implies that you would need to be able to short Vanguard funds, which you cannot do. Consequently, you realize that you need to add additional constraints so that the weights in each fund are positive. 5. Redo the tangency portfolio with positive weights. What do these weights now imply? How do these results sit with your intuitions about what factors produce high returns? The results seem to imply a large weight on a portfolio that you wouldn't have expected. You're about to shrug and just invest in the tangency portfolio. But then you remember another assumption of the CAPM - the tangency portfolio is only optimal when you have riskless borrowing! If you want a higher expected return than the tangency portfolio and you can't borrow and invest in the tangency, you may prefer a different mean-variance efficient portfolio. Based on this you decide to calculate the whole mean-variance efficient frontier, and see how the weights change in each case. You do this by first picking a level of standard deviation. Then you choose the weights (subject to weights being positive) to maximize expected return, subject to the constraint that the standard deviation of the portfolio is equal to the number you chose. 6. Calculate the mean-variance frontier, solving for optimal weights for standard deviations between 5.3 and 8.5 (in increments of 0.1 ). Show the expected returns, standard deviations, Sharpe ratios, and optimal weights for the portfolios. 7. What do these patterns in weights seem to suggest about what portfolio will generate the highest returns? Confirm this by forming a portfolio that maximizes expected returns without any regard to standard deviation or Sharpe ratios. How does this fit in with your intuition? Based on all this, you decide to invest in the maximum expected return portfolio. (If you cannot calculate this, assume that expected returns are maximized by investing 100% in the small value portfolio). You are nervous about investing in this portfolio, since it has a large loading on small value stocks. Your intuition tells you that perhaps you should invest in large growth stocks as well. 8. Calculate the correlation coefficient between the small value and the large growth portfolio. How correlated are the two portfolios? What does this tell you about how good a hedge large growth stocks are for small value stocks? Having settled upon your portfolio (again assume loading 100% in small value if you cannot calculate the answer), you decide to see how your new portfolio performance historically compares against two benchmarks - your idiot brother-in-law who equally weighted all of the Fama French portfolios because he didn't know what they meant (like you calculated in question 5), and your lazy class-mate who thought that investing in Index funds only meant buying the market portfolio. 9. What are the differences in expected returns between these three options
Step by Step Solution
There are 3 Steps involved in it
Step: 1

Get Instant Access to Expert-Tailored Solutions
See step-by-step solutions with expert insights and AI powered tools for academic success
Step: 2

Step: 3
Ace Your Homework with AI
Get the answers you need in no time with our AI-driven, step-by-step assistance
Get Started
Introduction To Personal Finance Beginning Your Financial Journey
Authors: Lance Palmer, John E. Grable
2nd Edition
1119797063, 978-1119797067