Answered step by step
Verified Expert Solution
Link Copied!

Question

1 Approved Answer

1. Add a sheet which contains a pivot table showing the three species and the number of penguins in each species. Sort the table by

1. Add a sheet which contains a pivot table showing the three species and the number of penguins in each species. Sort the table by the number of penguins in each species, with the highest shown first. (2 points) 2. Add a sheet which contains a pivot table showing average weight (body_mass_g), broken down by the species and sex. All numbers should be shown with commas (if 1,000 or over) and one digit to the right of the decimal point. (4 points) 3. Add a pivot chart to the the pivot table specified in #2. Make a clusters column chart with a cluster for species, and within the cluster, show the average weight of the males and females, but not the penguins where the sex is not recorded. (4 points)
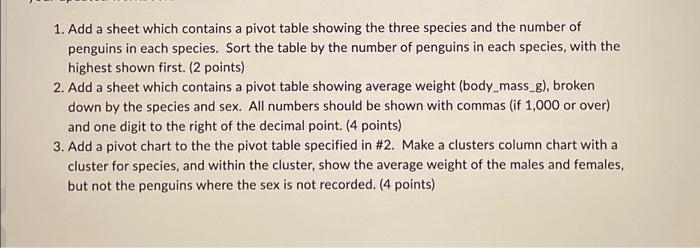
image text in transcribed
1. Add a sheet which contains a pivot table showing the three species and the number of penguins in each species. Sort the table by the number of penguins in each species, with the highest shown first. (2 points) 2. Add a sheet which contains a pivot table showing average weight (body_mass_g), broken down by the species and sex. All numbers should be shown with commas (if 1,000 or over) and one digit to the right of the decimal point. (4 points) 3. Add a pivot chart to the the pivot table specified in \#2. Make a clusters column chart with a cluster for species, and within the cluster, show the average weight of the males and females, but not the penguins where the sex is not recorded. ( 4 points) 1. Add a sheet which contains a pivot table showing the three species and the number of penguins in each species. Sort the table by the number of penguins in each species, with the highest shown first. (2 points) 2. Add a sheet which contains a pivot table showing average weight (body_mass_g), broken down by the species and sex. All numbers should be shown with commas (if 1,000 or over) and one digit to the right of the decimal point. (4 points) 3. Add a pivot chart to the the pivot table specified in \#2. Make a clusters column chart with a cluster for species, and within the cluster, show the average weight of the males and females, but not the penguins where the sex is not recorded. ( 4 points)

Step by Step Solution

There are 3 Steps involved in it

Step: 1

blur-text-image

Get Instant Access to Expert-Tailored Solutions

See step-by-step solutions with expert insights and AI powered tools for academic success

Step: 2

blur-text-image

Step: 3

blur-text-image

Ace Your Homework with AI

Get the answers you need in no time with our AI-driven, step-by-step assistance

Get Started

Recommended Textbook for

The Productivity Audit

Authors: Mark Spelman, Paul Spence

1st Edition

1907766073, 978-1907766077

More Books

Students also viewed these Accounting questions