Answered step by step
Verified Expert Solution
Question
1 Approved Answer
1. After some exhausting experiments where you measured the velocity of a frisky flying rabbit, you obtained the following data. Plot a velocity-time graph using
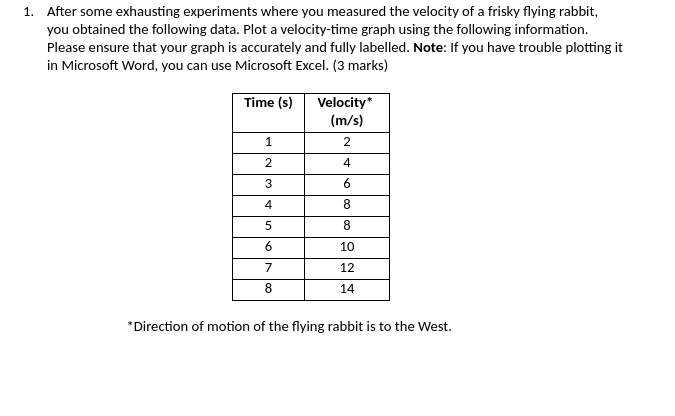
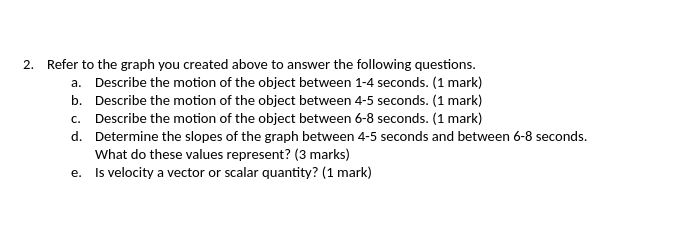
1. After some exhausting experiments where you measured the velocity of a frisky flying rabbit, you obtained the following data. Plot a velocity-time graph using the following information. Please ensure that your graph is accurately and fully labelled. Note: If you have trouble plotting it in Microsoft Word, you can use Microsoft Excel. (3 marks) Time (s) Velocity* (m/s) 2 4 3 6 4 8 8 6 10 7 12 8 14 *Direction of motion of the flying rabbit is to the West.2. Refer to the graph you created above to answer the following questions. a. Describe the motion of the object between 1-4 seconds. (1 mark) b. Describe the motion of the object between 4-5 seconds. (1 mark) c. Describe the motion of the object between 6-8 seconds. (1 mark) d. Determine the slopes of the graph between 4-5 seconds and between 6-8 seconds. What do these values represent? (3 marks) e. Is velocity a vector or scalar quantity? (1 mark)
Step by Step Solution
There are 3 Steps involved in it
Step: 1
Get Instant Access to Expert-Tailored Solutions
See step-by-step solutions with expert insights and AI powered tools for academic success
Step: 2
Step: 3
Ace Your Homework with AI
Get the answers you need in no time with our AI-driven, step-by-step assistance
Get Started