Answered step by step
Verified Expert Solution
Link Copied!

Question

1 Approved Answer

1. After some experimentation, you have observed the following data concerning the relationship between marketing and sales. Use Excel's curve fitting method to find the
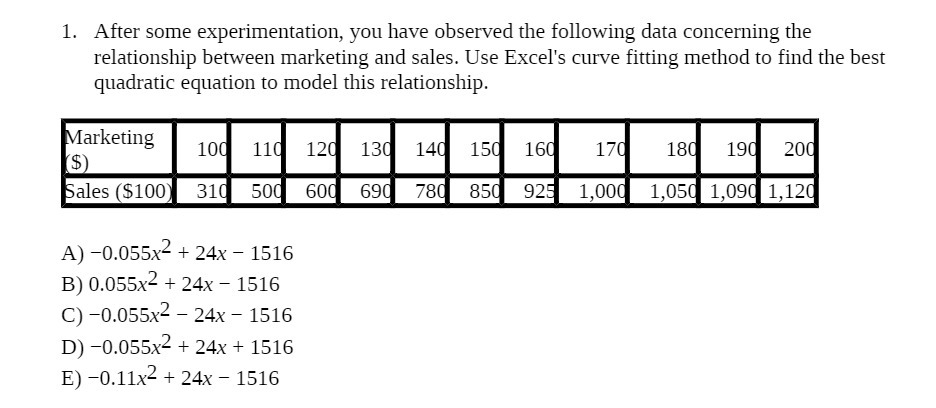
image text in transcribed
1. After some experimentation, you have observed the following data concerning the relationship between marketing and sales. Use Excel's curve fitting method to find the best quadratic equation to model this relationship. Marketing ($) 100 110 120 130 140 150 160 170 180 190 200 Sales ($100 310 500 600 690 780 850 925 1,000 1,050 1,090 1,120 A) -0.055x2 + 24x - 1516 B) 0.055x2 + 24x - 1516 C) -0.055x2 - 24x - 1516 D) -0.055x2 + 24x + 1516 E) -0.11x2 + 24x - 1516

Step by Step Solution

There are 3 Steps involved in it

Step: 1

blur-text-image

Get Instant Access to Expert-Tailored Solutions

See step-by-step solutions with expert insights and AI powered tools for academic success

Step: 2

blur-text-image

Step: 3

blur-text-image

Ace Your Homework with AI

Get the answers you need in no time with our AI-driven, step-by-step assistance

Get Started

Recommended Textbook for

Transportation A Global Supply Chain Perspective

Authors: John J. Coyle, Robert A. Novak, Brian Gibson, Edward J. Bard

8th edition

9781305445352, 1133592961, 130544535X, 978-1133592969

More Books

Students also viewed these Mathematics questions

Question

(b) Calculate the equilibrium price and quantity. pag67

Answered: 1 week ago