Question
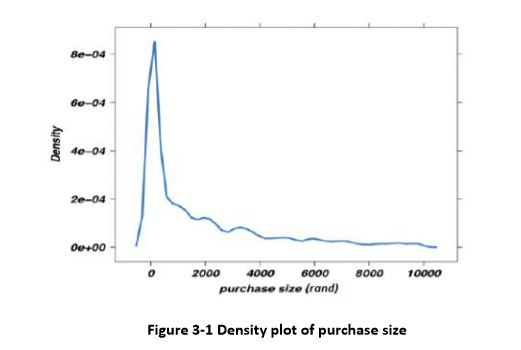
1. An online retailer wants to study the purchase behaviours of its customers. Figure 3-1 shows the density plot of the purchase sizes (in Rand).
1. An online retailer wants to study the purchase behaviours of its customers. Figure 3-1 shows the density plot of the purchase sizes (in Rand). What would be your recommendation to enhance the plot to detect more structures that otherwise might be missed? At least one paragraph. (Hint: 100 to 200 words in a paragraph).

2. Suppose everyone who visits a retail website gets one promotional offer or no promotion at all. We want to see if making a promotional offer makes a difference. What statistical method would you recommend for this analysis? At least one paragraph. (Hint: 100 to 200 words in a paragraph).
3. You are analysing two normally distributed populations, and your null hypothesis is that the mean 1 of the first population is equal to the mean 2 of the second. Assume the significance level is set at 0.05. If the observed p-value is 4.33e-05, what will be your decision regarding the null hypothesis? At least one paragraph. (Hint: 100 to 200 words in a paragraph).
Density 8000 10000 2000 4000 6000 purchase size (rand) Figure 3-1 Density plot of purchase sizeStep by Step Solution
There are 3 Steps involved in it
Step: 1

Get Instant Access to Expert-Tailored Solutions
See step-by-step solutions with expert insights and AI powered tools for academic success
Step: 2

Step: 3

Ace Your Homework with AI
Get the answers you need in no time with our AI-driven, step-by-step assistance
Get Started


