Question
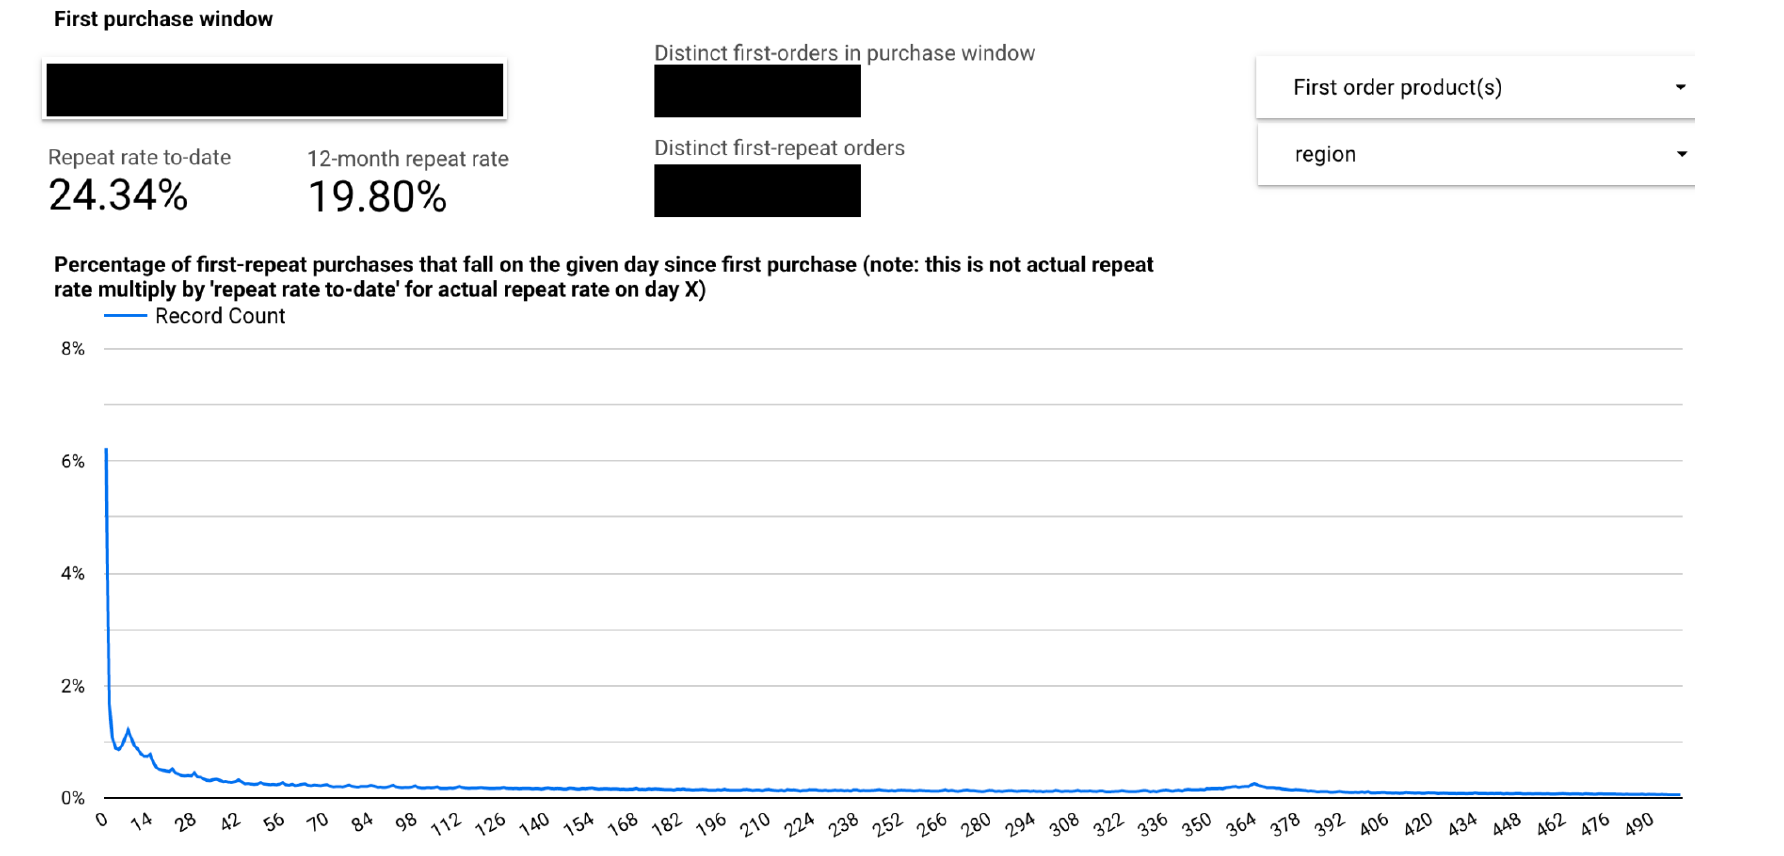
1. Analytics The chart below shows the repeat rate for new customers over a set period of time. You should read the curve as Of
1. Analytics
The chart below shows the repeat rate for new customers over a set period of time. You should
read the curve as "Of the customers that repeat, x% do so within x days of their first purchase."
Please answer the following questions and be prepared to discuss in detail
? What does "repeat rate to-date" signify?
? What is the difference in meaning between that and the 12-month repeat rate?
? Why might the repeat rate to date be higher than the 12-month repeat rate?
? What are the noteworthy patterns represented in the curve? What makes them
noteworthy?
? Why might there be a large number of customers who repeat-purchase on day
zero? Is it noise in the data or is there maybe a trend? How would you go about
answering that question?
? What additional questions would you have from this data? Are there cuts you
would explore first? Why?

Step by Step Solution
There are 3 Steps involved in it
Step: 1

Get Instant Access to Expert-Tailored Solutions
See step-by-step solutions with expert insights and AI powered tools for academic success
Step: 2

Step: 3

Ace Your Homework with AI
Get the answers you need in no time with our AI-driven, step-by-step assistance
Get Started


