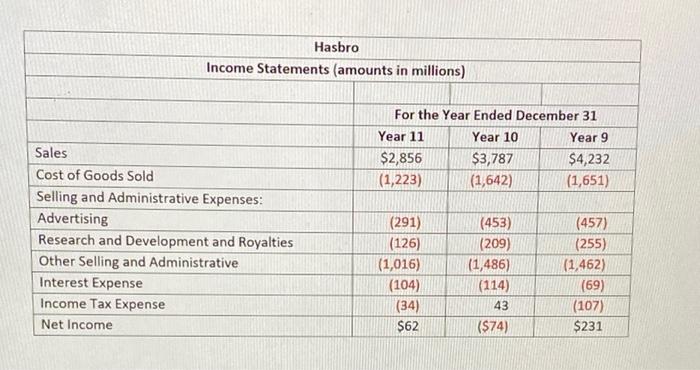
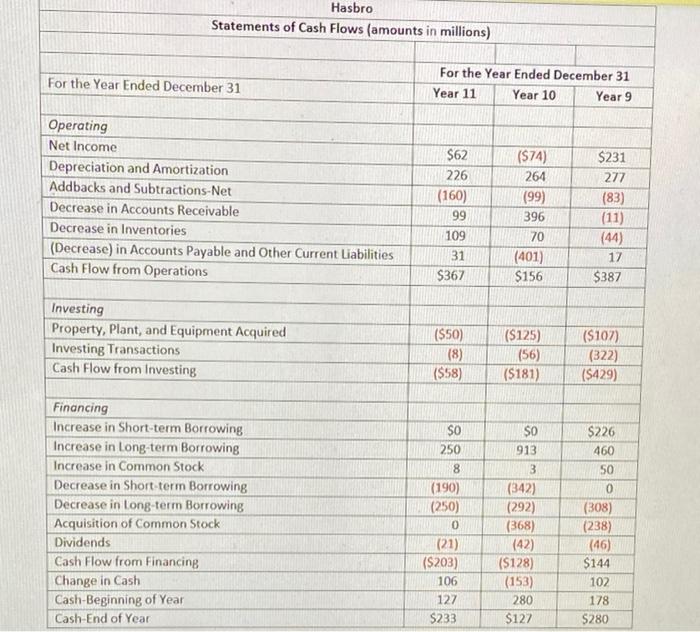
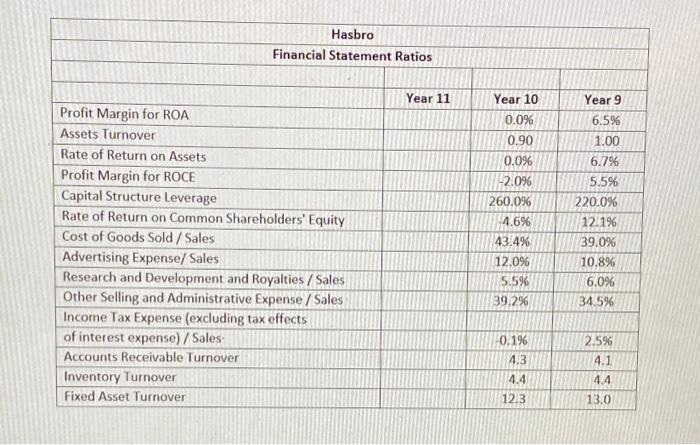
1. Analyze the changes in ROA and its components of Hasbro over the three-year period, suggesting reasons for the changes observed. 5-6 sentences.
2. Analyze the changes in ROCE and its components of Hasbro over the three-year period, suggesting reasons for the changes observed. 5-6 sentences.
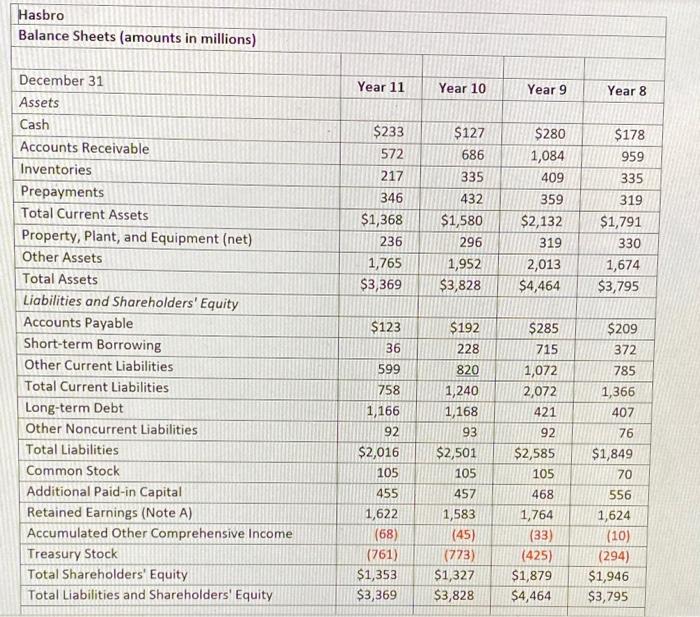
Hasbro Balance Sheets (amounts in millions) Year 11 Year 10 Year 9 Year 8 $233 572 217 346 $1,368 236 1,765 $3,369 $127 686 335 432 $1,580 296 1,952 $3,828 $280 1,084 409 359 $2,132 319 2,013 $4,464 $178 959 335 319 $1,791 330 1,674 $3,795 December 31 Assets Cash Accounts Receivable Inventories Prepayments Total Current Assets Property, Plant, and Equipment (net) Other Assets Total Assets Liabilities and Shareholders' Equity Accounts Payable Short-term Borrowing Other Current Liabilities Total Current Liabilities Long-term Debt Other Noncurrent Liabilities Total Liabilities Common Stock Additional Paid-in Capital Retained Earnings (Note A) Accumulated Other Comprehensive Income Treasury Stock Total Shareholders' Equity Total Liabilities and Shareholders' Equity $123 36 $192 228 599 820 $285 715 1,072 2,072 421 92 $2,585 105 758 1,166 92 $2,016 105 455 1,622 (68) (761) $1,353 $3,369 1,240 1,168 93 $2,501 105 457 1,583 (45) (773) $1,327 $3,828 $209 372 785 1,366 407 76 $1,849 70 556 1,624 (10) (294) $1,946 $3,795 468 1,764 (33) (425) $1,879 $4,464 Hasbro Income Statements (amounts in millions) For the Year Ended December 31 Year 11 Year 10 Year 9 $2,856 $3,787 $4,232 (1,223) (1,642) (1,651) Sales Cost of Goods Sold Selling and Administrative Expenses: Advertising Research and Development and Royalties Other Selling and Administrative Interest Expense Income Tax Expense Net Income (291) (126) (1,016) (104) (34) $62 (453) (209) (1,486) (114) 43 ($74) (457) (255) (1,462) (69) (107) $231 Hasbro Statements of Cash Flows (amounts in millions) For the Year Ended December 31 For the Year Ended December 31 Year 11 Year 10 Year 9 Operating Net Income Depreciation and Amortization Addbacks and Subtractions-Net Decrease in Accounts Receivable Decrease in Inventories (Decrease) in Accounts Payable and Other Current Liabilities Cash Flow from Operations $62 226 (160) 99 109 31 $367 (574) 264 (99) 396 70 (401) $156 $231 277 (83) (11) (44) 17 $387 Investing Property, Plant, and Equipment Acquired Investing Transactions Cash Flow from Investing ($50) (8) ($58) ($125) (56) ($181) ($107) (322) ($429) SO 250 SO 913 8 3 Financing Increase in Short-term Borrowing Increase in long-term Borrowing Increase in Common Stock Decrease in Short-term Borrowing Decrease in long-term Borrowing Acquisition of Common Stock Dividends Cash Flow from Financing Change in Cash Cash-Beginning of Year Cash-End of Year (190) (250) 0 (21) ($203) 106 127 $233 (342) (292) (368) (42) (5128) (153) 280 $127 $226 460 50 0 (308) (238) (46) $144 102 178 $280 Hasbro Financial Statement Ratios Year 11 Year 10 0.0% 0.90 0.0% -2.0% Profit Margin for ROA Assets Turnover Rate of Return on Assets Profit Margin for ROCE Capital Structure Leverage Rate of Return on Common Shareholders' Equity Cost of Goods Sold / Sales Advertising Expense/ Sales Research and Development and Royalties / Sales Other Selling and Administrative Expense / Sales Income Tax Expense (excluding tax effects of interest expense) / Sales Accounts Receivable Turnover Inventory Turnover Fixed Asset Turnover 260.0% 4.6% 43.4% 12.0% 5.596 39.2% Year 9 6.5% 1.00 6.7% 5.5% 220.0% 12.1% 39.0% 10.8% 6.096 34.5% 0.1% 2.596 4.1 4.3 4.4 4.4 12.3 13.0


