Answered step by step
Verified Expert Solution
Link Copied!

Question

1 Approved Answer

1. Analyze the cost data in the Excel workbook ChOSData.xlsx for the Costbusters Company. What percent of sales are represented by each category of cost
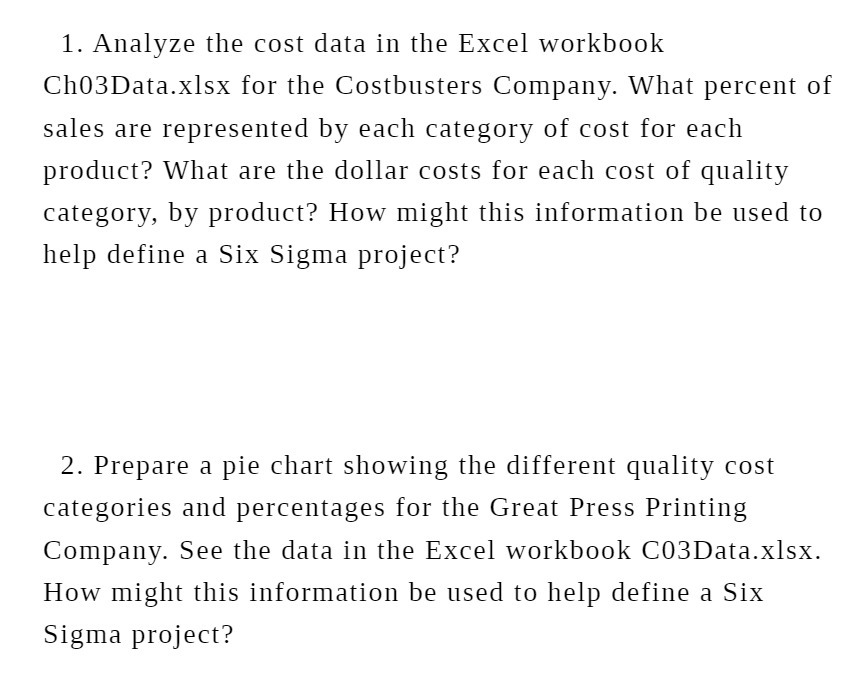
image text in transcribed
1. Analyze the cost data in the Excel workbook ChOSData.xlsx for the Costbusters Company. What percent of sales are represented by each category of cost for each product? What are the dollar costs for each cost of quality category, by product? How might this information be used to help define a Six Sigma project? 2. Prepare a pie chart showing the different quality cost categories and percentages for the Great Press Printing Company. See the data in the Excel workbook CDBDataxlsx. How might this information be used to help define a Six Sigma project

Step by Step Solution

There are 3 Steps involved in it

Step: 1

blur-text-image

Get Instant Access to Expert-Tailored Solutions

See step-by-step solutions with expert insights and AI powered tools for academic success

Step: 2

blur-text-image

Step: 3

blur-text-image

Ace Your Homework with AI

Get the answers you need in no time with our AI-driven, step-by-step assistance

Get Started

Recommended Textbook for

Management

Authors: Chuck Williams

4th Edition

978-0324316797, 0324316798

More Books

Students also viewed these General Management questions

Question

Compare and Contrast file Systems with database systems?

Answered: 1 week ago

Question

Define Data Abstraction and dinsuun levels of Abstraction?

Answered: 1 week ago