

Answered step by step
Verified Expert Solution
Question
1 Approved Answer
1 and 2 and 3 please Use the provided data to answer all parts. Part 1: Calculate the final absorbances from the data below and
1 and 2 and 3 please 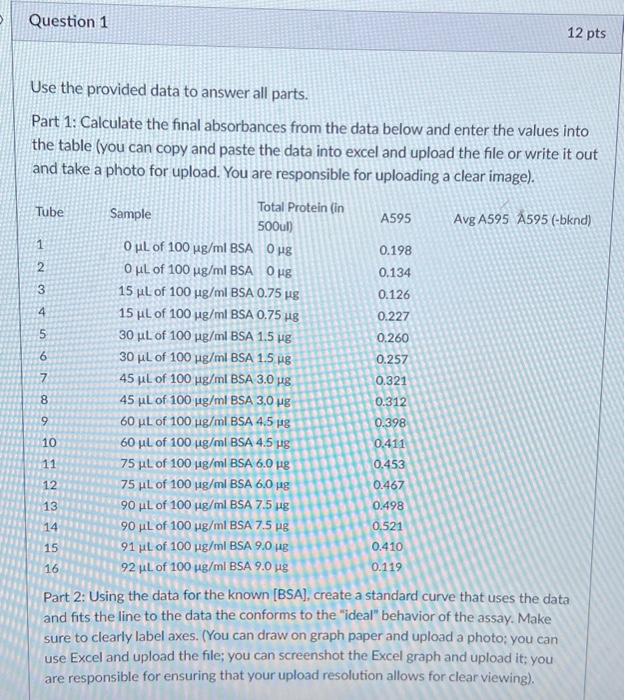
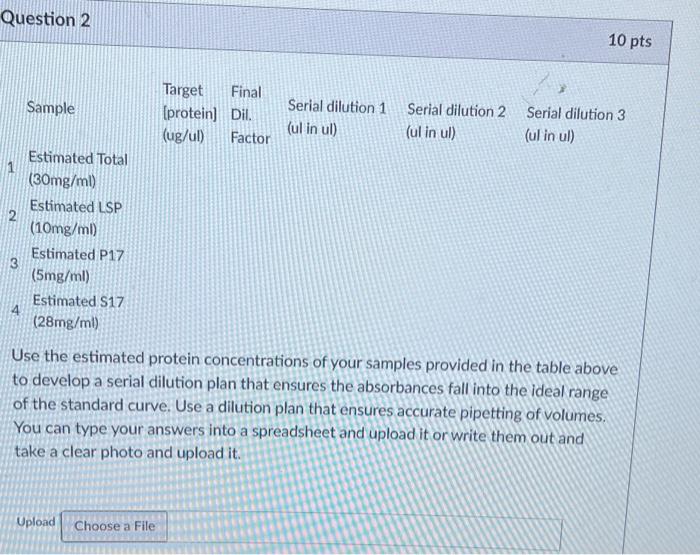
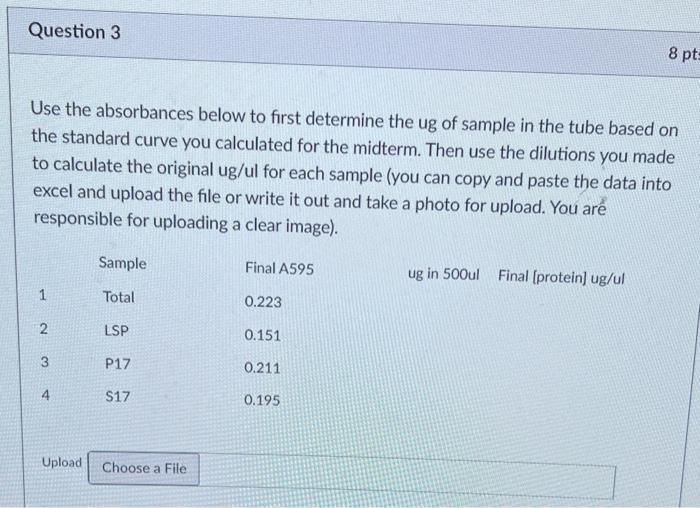
Use the provided data to answer all parts. Part 1: Calculate the final absorbances from the data below and enter the values into the table (you can copy and paste the data into excel and upload the file or write it out and take a photo for upload. You are responsible for uploading a clear image). Avg A595 A595 (-bknd) Part 2: Using the data for the known [BSA], create a standard curve that uses the data and fits the line to the data the conforms to the "ideal" behavior of the assay. Make sure to clearly label axes. (You can draw on graph paper and upload a photo: you can use Excel and upload the file; you can screenshot the Excel graph and upload it; you are responsible for ensuring that your upload resolution allows for clear viewing). Use the estimated protein concentrations of your samples provided in the table above to develop a serial dilution plan that ensures the absorbances fall into the ideal range of the standard curve. Use a dilution plan that ensures accurate pipetting of volumes. You can type your answers into a spreadsheet and upload it or write them out and take a clear photo and upload it. Use the absorbances below to first determine the ug of sample in the tube based on the standard curve you calculated for the midterm. Then use the dilutions you made to calculate the original ug/ul for each sample (you can copy and paste the data into excel and upload the file or write it out and take a photo for upload. You are responsible for uploading a clear image). Use the provided data to answer all parts. Part 1: Calculate the final absorbances from the data below and enter the values into the table (you can copy and paste the data into excel and upload the file or write it out and take a photo for upload. You are responsible for uploading a clear image). Avg A595 A595 (-bknd) Part 2: Using the data for the known [BSA], create a standard curve that uses the data and fits the line to the data the conforms to the "ideal" behavior of the assay. Make sure to clearly label axes. (You can draw on graph paper and upload a photo: you can use Excel and upload the file; you can screenshot the Excel graph and upload it; you are responsible for ensuring that your upload resolution allows for clear viewing). Use the estimated protein concentrations of your samples provided in the table above to develop a serial dilution plan that ensures the absorbances fall into the ideal range of the standard curve. Use a dilution plan that ensures accurate pipetting of volumes. You can type your answers into a spreadsheet and upload it or write them out and take a clear photo and upload it. Use the absorbances below to first determine the ug of sample in the tube based on the standard curve you calculated for the midterm. Then use the dilutions you made to calculate the original ug/ul for each sample (you can copy and paste the data into excel and upload the file or write it out and take a photo for upload. You are responsible for uploading a clear image) Step by Step Solution
There are 3 Steps involved in it
Step: 1

Get Instant Access to Expert-Tailored Solutions
See step-by-step solutions with expert insights and AI powered tools for academic success
Step: 2

Step: 3
Ace Your Homework with AI
Get the answers you need in no time with our AI-driven, step-by-step assistance
Get Started
Statistical Reasoning for Everyday Life
Authors: Jeff Bennett, Bill Briggs, Mario F. Triola
4th edition
978-0321817747, 321817745, 978-0321890139, 321890132, 321817621, 978-0321817624