

Answered step by step
Verified Expert Solution
Question
1 Approved Answer
1 and 2 sheet are together.. I couldn't merge them together.. then the last sheet is the questions. and I want all solution written out.
1 and 2 sheet are together.. I couldn't merge them together.. then the last sheet is the questions. and I want all solution written out. thanks
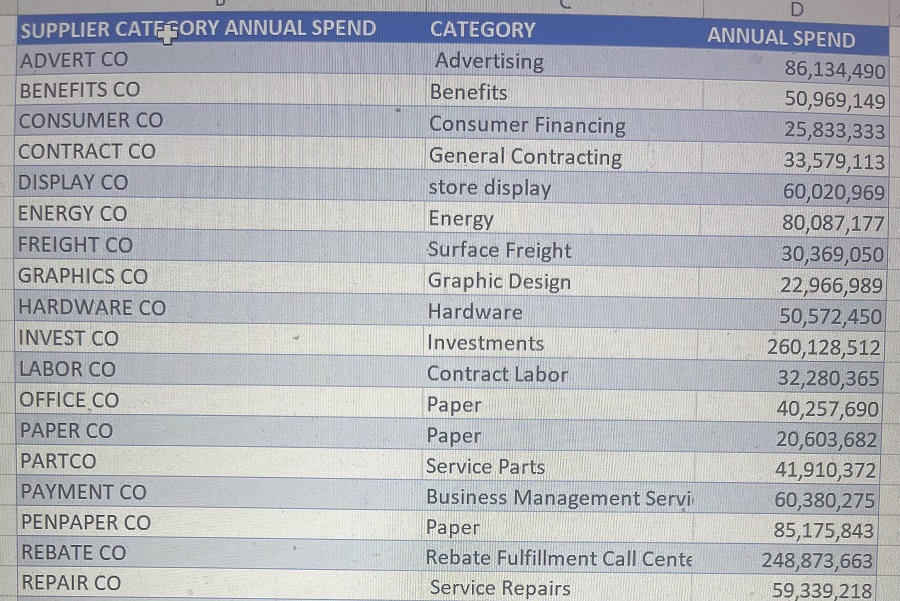
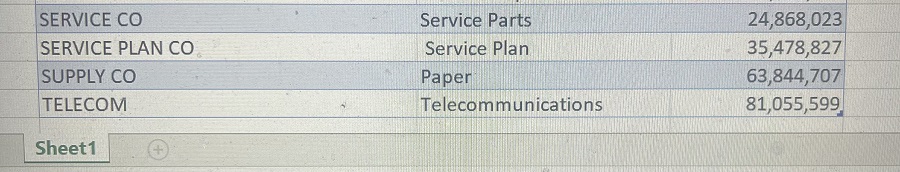
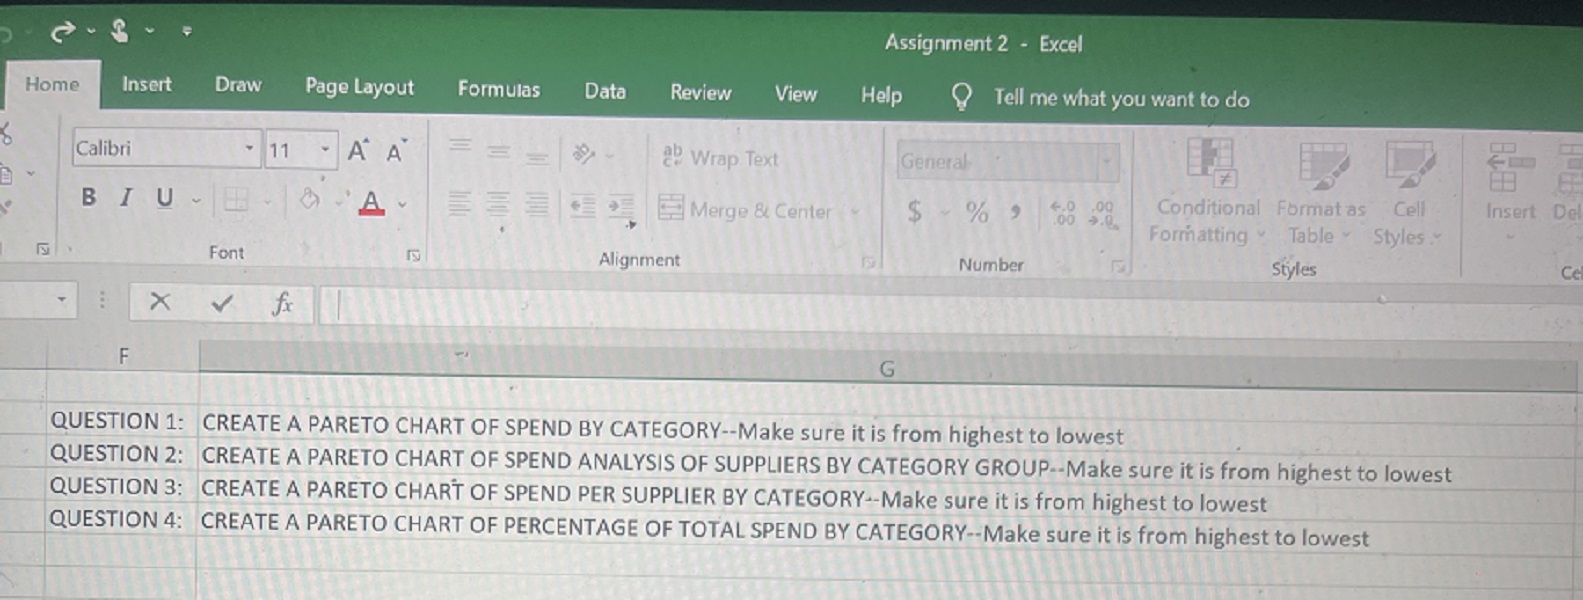
\begin{tabular}{llr} \hline SUPPLIER CATESORY ANNUAL SPEND & CATEGORY & \multicolumn{1}{c}{ D } \\ \hline ADVERT CO & Advertising & 86,134,490 \\ \hline BENEFITS CO & Benefits & 50,969,149 \\ \hline CONSUMER CO & Consumer Financing & 25,833,333 \\ \hline CONTRACT CO & General Contracting & 33,579,113 \\ \hline DISPLAY CO & store display & 60,020,969 \\ \hline ENERGY CO & Energy & 80,087,177 \\ \hline FREIGHT CO & Surface Freight & 30,369,050 \\ \hline GRAPHICS CO & Graphic Design & 22,966,989 \\ \hline HARDWARE CO & Hardware & 50,572,450 \\ \hline INVEST CO & Investments & 260,128,512 \\ \hline LABOR CO & Contract Labor & 32,280,365 \\ \hline OFFICE CO & Paper & 40,257,690 \\ \hline PAPER CO & Paper & 20,603,682 \\ \hline PARTCO & Service Parts & 41,910,372 \\ \hline PAYMENT CO & Business Management Servi & 60,380,275 \\ \hline PENPAPER CO & Paper & 85,175,843 \\ \hline REBATE CO & Rebate Fulfillment Call Cente & 248,873,663 \\ \hline REPAIR CO & Service Repairs & 59,339,218 \end{tabular} \begin{tabular}{|llr|} \hline SERVICE CO & Service Parts & 24,868,023 \\ \hline SERVICE PLAN CO & Service Plan & 35,478,827 \\ \hline SUPPLY CO & Paper & 63,844,707 \\ \hline TELECOM & Telecommunications & 81,055,599 \\ \hline \end{tabular} Assignment 2 - Excel Home Insert Draw Page Layout Formulas Data Review View Help Tell me what you want to do Calibri 11A A B I A Font 5 Alignment Merge \& Center Ffx G QUESTION 1: CREATE A PARETO CHART OF SPEND BY CATEGORY--Make sure it is from highest to lowest QUESTION 2: CREATE A PARETO CHART OF SPEND ANALYSIS OF SUPPLIERS BY CATEGORY GROUP.--Make sure it is from highest to lowest QUESTION 3: CREATE A PARETO CHART OF SPEND PER SUPPLIER BY CATEGORY-Make sure it is from highest to lowest QUESTION 4: CREATE A PARETO CHART OF PERCENTAGE OF TOTAL SPEND BY CATEGORY--Make sure it is from highest to lowest \begin{tabular}{llr} \hline SUPPLIER CATESORY ANNUAL SPEND & CATEGORY & \multicolumn{1}{c}{ D } \\ \hline ADVERT CO & Advertising & 86,134,490 \\ \hline BENEFITS CO & Benefits & 50,969,149 \\ \hline CONSUMER CO & Consumer Financing & 25,833,333 \\ \hline CONTRACT CO & General Contracting & 33,579,113 \\ \hline DISPLAY CO & store display & 60,020,969 \\ \hline ENERGY CO & Energy & 80,087,177 \\ \hline FREIGHT CO & Surface Freight & 30,369,050 \\ \hline GRAPHICS CO & Graphic Design & 22,966,989 \\ \hline HARDWARE CO & Hardware & 50,572,450 \\ \hline INVEST CO & Investments & 260,128,512 \\ \hline LABOR CO & Contract Labor & 32,280,365 \\ \hline OFFICE CO & Paper & 40,257,690 \\ \hline PAPER CO & Paper & 20,603,682 \\ \hline PARTCO & Service Parts & 41,910,372 \\ \hline PAYMENT CO & Business Management Servi & 60,380,275 \\ \hline PENPAPER CO & Paper & 85,175,843 \\ \hline REBATE CO & Rebate Fulfillment Call Cente & 248,873,663 \\ \hline REPAIR CO & Service Repairs & 59,339,218 \end{tabular} \begin{tabular}{|llr|} \hline SERVICE CO & Service Parts & 24,868,023 \\ \hline SERVICE PLAN CO & Service Plan & 35,478,827 \\ \hline SUPPLY CO & Paper & 63,844,707 \\ \hline TELECOM & Telecommunications & 81,055,599 \\ \hline \end{tabular} Assignment 2 - Excel Home Insert Draw Page Layout Formulas Data Review View Help Tell me what you want to do Calibri 11A A B I A Font 5 Alignment Merge \& Center Ffx G QUESTION 1: CREATE A PARETO CHART OF SPEND BY CATEGORY--Make sure it is from highest to lowest QUESTION 2: CREATE A PARETO CHART OF SPEND ANALYSIS OF SUPPLIERS BY CATEGORY GROUP.--Make sure it is from highest to lowest QUESTION 3: CREATE A PARETO CHART OF SPEND PER SUPPLIER BY CATEGORY-Make sure it is from highest to lowest QUESTION 4: CREATE A PARETO CHART OF PERCENTAGE OF TOTAL SPEND BY CATEGORY--Make sure it is from highest to lowestStep by Step Solution
There are 3 Steps involved in it
Step: 1

Get Instant Access to Expert-Tailored Solutions
See step-by-step solutions with expert insights and AI powered tools for academic success
Step: 2

Step: 3
Ace Your Homework with AI
Get the answers you need in no time with our AI-driven, step-by-step assistance
Get Started
Law And Order Review 1993 An Audit Of Crime Policing And Criminal Justice Issues
Authors: John Benyon
1st Edition
1874493901, 978-1874493907