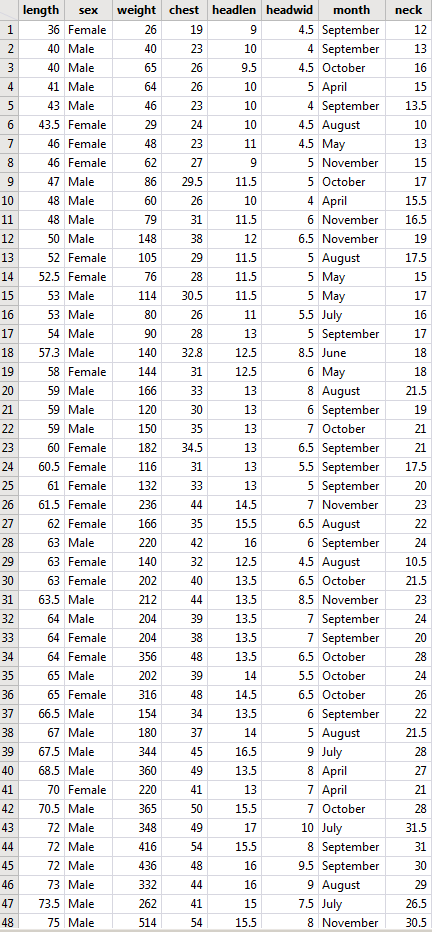
1. Animal ecologists wish to track the health of bear populations in the wild. By obtaining physical measure- ments of bears, researchers can gauge the effects of changes taking place in and around bear habitat (e.g.. nearby housing and business development, recreational activities, introduction of non-native plant and animal species, severe storms, harsh winters, ctc.). Researchers have studied bears by anesthetizing them in order to obtain vital measurements, such as age, gender, length, and width. A bear's weight is another important variable that is quite difficult to obtain in the wild because most bears are heavy and difficult to lift. The scientific problem is to develop a method for predicting the weight of a bear, given other more easily obtained measurements. A good method might alleviate the need to weigh bears in the wild and greatly simplify the In one detailed study, researchers were able to obtain weight measurements along with several other variables for each of 48 bears. The file bears.txt contains the data for 48 bears. There is one row for each bear that was anesthetized and measured carefully using a tape measure and scale. There is one column for each variable in the data set. The variables (from left to right) are length: length of body (in inches) sex: male or female weight: weight (in pounds) chest: chest circumference (in inches) headlth: length of head (in inches) headwth: width of head (in inches) month: month of capture neck: neck circumference (in inches) (a) Construct a scatterplot matrix of all the variables in the data set. Include the graph obtained and comment on the relationships between Y and the explanatory variables. When possible, describe the strength, direction, and type of relationship. (b) Estimate the parameters in the multiple regression model with weight as the response variable and chest, length, and neck as explanatory variables. Specifically, provide an estimate of the intercept, an esti- mate of the partial regression coefficient for each explanatory variable, and an estimate of the standard deviation of bear weights for any given values of the explanatory variables. (c) Conduct one test of the null hypothesis that says that the partial regression coefficients for chest, neck and length are all zero against the alternative that at least one coefficient is not. State the hypotheses, the test statistic, the degrees of freedom, p-value and conclusion (d) Provide an interpretation of the partial regression coefficient associated with the variable chest. (c) Compute a 95% confidence interval for the partial regression coefficient associated with the variable length. Is the partial regression coefficient associated with the variable length significantly different from zero? Explain how your confidence interval can be used to answer this question. 1. Animal ecologists wish to track the health of bear populations in the wild. By obtaining physical measure- ments of bears, researchers can gauge the effects of changes taking place in and around bear habitat (e.g.. nearby housing and business development, recreational activities, introduction of non-native plant and animal species, severe storms, harsh winters, ctc.). Researchers have studied bears by anesthetizing them in order to obtain vital measurements, such as age, gender, length, and width. A bear's weight is another important variable that is quite difficult to obtain in the wild because most bears are heavy and difficult to lift. The scientific problem is to develop a method for predicting the weight of a bear, given other more easily obtained measurements. A good method might alleviate the need to weigh bears in the wild and greatly simplify the In one detailed study, researchers were able to obtain weight measurements along with several other variables for each of 48 bears. The file bears.txt contains the data for 48 bears. There is one row for each bear that was anesthetized and measured carefully using a tape measure and scale. There is one column for each variable in the data set. The variables (from left to right) are length: length of body (in inches) sex: male or female weight: weight (in pounds) chest: chest circumference (in inches) headlth: length of head (in inches) headwth: width of head (in inches) month: month of capture neck: neck circumference (in inches) (a) Construct a scatterplot matrix of all the variables in the data set. Include the graph obtained and comment on the relationships between Y and the explanatory variables. When possible, describe the strength, direction, and type of relationship. (b) Estimate the parameters in the multiple regression model with weight as the response variable and chest, length, and neck as explanatory variables. Specifically, provide an estimate of the intercept, an esti- mate of the partial regression coefficient for each explanatory variable, and an estimate of the standard deviation of bear weights for any given values of the explanatory variables. (c) Conduct one test of the null hypothesis that says that the partial regression coefficients for chest, neck and length are all zero against the alternative that at least one coefficient is not. State the hypotheses, the test statistic, the degrees of freedom, p-value and conclusion (d) Provide an interpretation of the partial regression coefficient associated with the variable chest. (c) Compute a 95% confidence interval for the partial regression coefficient associated with the variable length. Is the partial regression coefficient associated with the variable length significantly different from zero? Explain how your confidence interval can be used to answer this