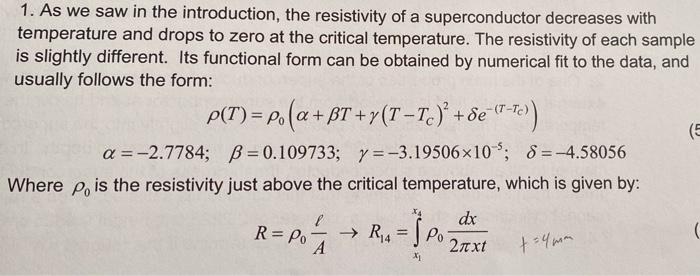
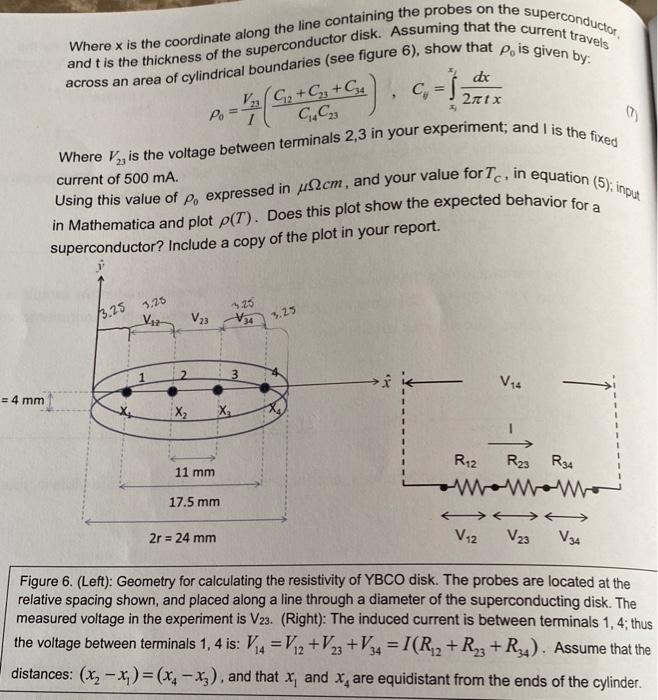
1. As we saw in the introduction, the resistivity of a superconductor decreases with temperature and drops to zero at the critical temperature. The resistivity of each sample is slightly different. Its functional form can be obtained by numerical fit to the data, and usually follows the form: + Se (E a=-2.7784; B=0.109733; y=-3.19506x10-'; 8 = -4.58056 Where po is the resistivity just above the critical temperature, which is given by: dx R= Po Pota R&= SP ( 27txt t = 4mm 11 and t is the thickness of the superconductor disk. Assuming that the current travels Where x is the coordinate along the line containing the probes on the superconductor across an area of cylindrical boundaries (see figure 6). show that Po is given by: dx C 2 23 G+G +G. , Po Where is the voltage between terminals 2,3 in your experiment, and I is the fixed Using this value of P, expressed in 2cm, and your value for Tc. in equation (5), input current of 500 mA. in Mathematica and plot p(T). Does this plot show the expected behavior for a superconductor? Include a copy of the plot in your report. 3.25 5.23 13.25 V V23 3.25 2 Vas = 4 mm X2 R12 R23 R34 11 mm 17.5 mm 2r = 24 mm V12 V23 Vas Figure 6. (Left): Geometry for calculating the resistivity of YBCO disk. The probes are located at the relative spacing shown, and placed along a line through a diameter of the superconducting disk. The measured voltage in the experiment is V23. (Right): The induced current is between terminals 1,4; thus the voltage between terminals 1,4 is: V = V2 +V23 + V34 = I(R2 + R2 + R3). Assume that the distances: (x2 - x)=(x4 - X), and that x, and X, are equidistant from the ends of the cylinder. 1. As we saw in the introduction, the resistivity of a superconductor decreases with temperature and drops to zero at the critical temperature. The resistivity of each sample is slightly different. Its functional form can be obtained by numerical fit to the data, and usually follows the form: + Se (E a=-2.7784; B=0.109733; y=-3.19506x10-'; 8 = -4.58056 Where po is the resistivity just above the critical temperature, which is given by: dx R= Po Pota R&= SP ( 27txt t = 4mm 11 and t is the thickness of the superconductor disk. Assuming that the current travels Where x is the coordinate along the line containing the probes on the superconductor across an area of cylindrical boundaries (see figure 6). show that Po is given by: dx C 2 23 G+G +G. , Po Where is the voltage between terminals 2,3 in your experiment, and I is the fixed Using this value of P, expressed in 2cm, and your value for Tc. in equation (5), input current of 500 mA. in Mathematica and plot p(T). Does this plot show the expected behavior for a superconductor? Include a copy of the plot in your report. 3.25 5.23 13.25 V V23 3.25 2 Vas = 4 mm X2 R12 R23 R34 11 mm 17.5 mm 2r = 24 mm V12 V23 Vas Figure 6. (Left): Geometry for calculating the resistivity of YBCO disk. The probes are located at the relative spacing shown, and placed along a line through a diameter of the superconducting disk. The measured voltage in the experiment is V23. (Right): The induced current is between terminals 1,4; thus the voltage between terminals 1,4 is: V = V2 +V23 + V34 = I(R2 + R2 + R3). Assume that the distances: (x2 - x)=(x4 - X), and that x, and X, are equidistant from the ends of the cylinder


