

Question
1. Assume that Alpha and Omega compete in the same four-digit SIC code industry and offer comparable products and services. The following table contains their
1. Assume that Alpha and Omega compete in the same four-digit SIC code industry and offer comparable products and services. The following table contains their reported financial performance and condition for the last two years:
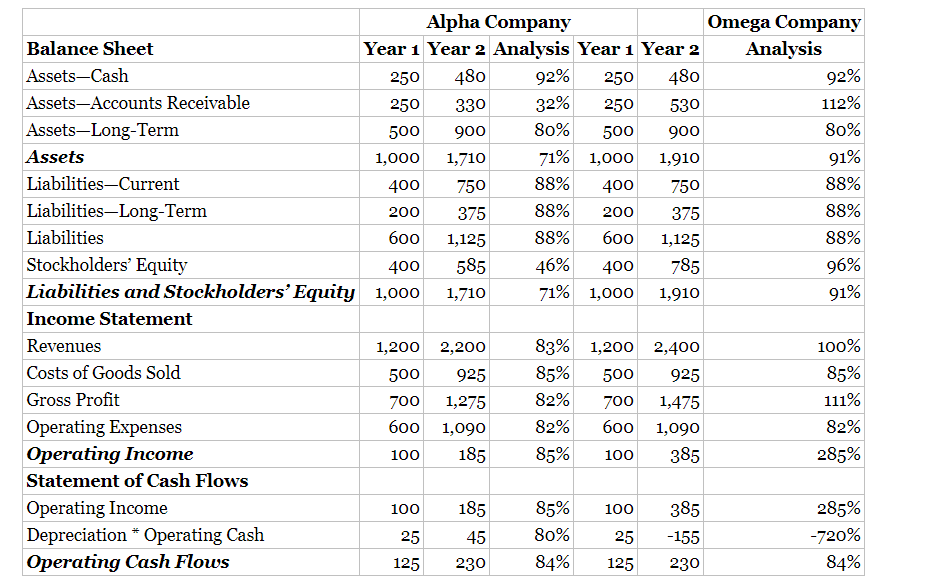
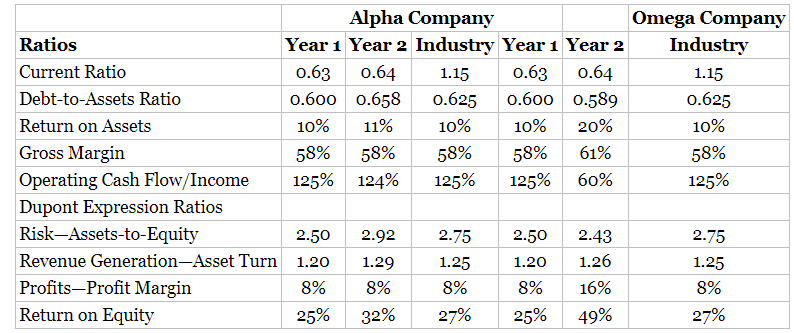
2. Assume that industry ratios were derived from a reputable source. Compute the year 1 and year 2 ratios for Alpha and Omega:
- Using your calculated ratios from assignment 2 in concert with the metrics calculated in assignment 1, complete the following assignments:
- Describe any symptoms of fraud
- Combine the findings in the ratio analysis with the metrics calculated in assignment 1 and draw a conclusion about fraud predication and recommend next steps.
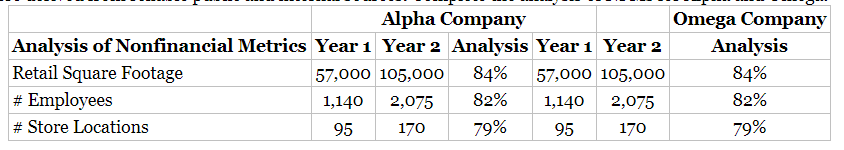
- Assume that nonfinancial metrics were derived from reliable public and internal sources. Complete the analysis of NFMs for Alpha and Omega:
5. Using your calculated metrics from assignments 1 an 2 in concert with the metrics calculated in assignment 4, complete the following assignments:
- Describe any symptoms of fraud
- Combine the findings in the NFMs with the ratio analysis computed in assignment 2 and percentages calculated in assignment 1 and draw a conclusion about fraud predication and recommend next steps.
32% Alpha Company Omega Company Balance Sheet Year 1 Year 2 Analysis Year 1 Year 2 Analysis Assets-Cash 250 480 92% 250 480 92% Assets-Accounts Receivable 250 330 250 530 112% Assets-Long-Term 500 900 80% 500 900 80% Assets 1,000 1,710 71% 1,000 1,910 91% Liabilities-Current 400 750 88% 400 750 88% Liabilities-Long-Term 200 375 88% 200 375 88% Liabilities 600 1,125 88% 600 1,125 88% Stockholders' Equity 400 585 46% 400 785 96% Liabilities and Stockholders' Equity 1,000 1,710 71% 1,000 1,910 91% Income Statement Revenues 1,200 2,200 83% 1,200 2,400 100% Costs of Goods Sold 500 925 85% 500 925 85% Gross Profit 700 1,275 82% 700 1,475 111% Operating Expenses 600 1,090 82% 600 1,090 82% Operating Income 100 185 85% 100 385 285% Statement of Cash Flows Operating Income 100 185 85% 100 385 285% Depreciation * Operating Cash 25 45 80% 25 -155 -720% Operating Cash Flows 125 230 84% 125 230 84% Alpha Company Omega Company Ratios Year 1 Year 2 Industry Year 1 Year 2 Industry Current Ratio 0.63 0.64 1.15 0.63 0.64 1.15 Debt-to-Assets Ratio 0.600 0.658 0.625 0.600 0.589 0.625 Return on Assets 10% 11% 10% 10% 20% 10% Gross Margin 58% 58% 58% 58% 61% 58% Operating Cash Flow/Income 125% 124% 125% 125% 60% 125% Dupont Expression Ratios Risk-Assets-to-Equity 2.50 2.92 2.75 2.50 2.43 2.75 Revenue Generation-Asset Turn 1.20 1.29 1.25 1.20 1.26 1.25 Profits-Profit Margin 8% 8% 8% 8% 16% 8% Return on Equity 25% 32% 27% 25% 49% 27% Alpha Company Omega Company Analysis of Nonfinancial Metrics Year 1 Year 2 Analysis Year 1 Year 2 Analysis Retail Square Footage 57,000 105,000 84% 57,000 105,000 84% # Employees 1,140 2,075 82% 1,140 2,075 82% # Store Locations 95 170 79% 95 170 79% 32% Alpha Company Omega Company Balance Sheet Year 1 Year 2 Analysis Year 1 Year 2 Analysis Assets-Cash 250 480 92% 250 480 92% Assets-Accounts Receivable 250 330 250 530 112% Assets-Long-Term 500 900 80% 500 900 80% Assets 1,000 1,710 71% 1,000 1,910 91% Liabilities-Current 400 750 88% 400 750 88% Liabilities-Long-Term 200 375 88% 200 375 88% Liabilities 600 1,125 88% 600 1,125 88% Stockholders' Equity 400 585 46% 400 785 96% Liabilities and Stockholders' Equity 1,000 1,710 71% 1,000 1,910 91% Income Statement Revenues 1,200 2,200 83% 1,200 2,400 100% Costs of Goods Sold 500 925 85% 500 925 85% Gross Profit 700 1,275 82% 700 1,475 111% Operating Expenses 600 1,090 82% 600 1,090 82% Operating Income 100 185 85% 100 385 285% Statement of Cash Flows Operating Income 100 185 85% 100 385 285% Depreciation * Operating Cash 25 45 80% 25 -155 -720% Operating Cash Flows 125 230 84% 125 230 84% Alpha Company Omega Company Ratios Year 1 Year 2 Industry Year 1 Year 2 Industry Current Ratio 0.63 0.64 1.15 0.63 0.64 1.15 Debt-to-Assets Ratio 0.600 0.658 0.625 0.600 0.589 0.625 Return on Assets 10% 11% 10% 10% 20% 10% Gross Margin 58% 58% 58% 58% 61% 58% Operating Cash Flow/Income 125% 124% 125% 125% 60% 125% Dupont Expression Ratios Risk-Assets-to-Equity 2.50 2.92 2.75 2.50 2.43 2.75 Revenue Generation-Asset Turn 1.20 1.29 1.25 1.20 1.26 1.25 Profits-Profit Margin 8% 8% 8% 8% 16% 8% Return on Equity 25% 32% 27% 25% 49% 27% Alpha Company Omega Company Analysis of Nonfinancial Metrics Year 1 Year 2 Analysis Year 1 Year 2 Analysis Retail Square Footage 57,000 105,000 84% 57,000 105,000 84% # Employees 1,140 2,075 82% 1,140 2,075 82% # Store Locations 95 170 79% 95 170 79%
Step by Step Solution
There are 3 Steps involved in it
Step: 1

Get Instant Access to Expert-Tailored Solutions
See step-by-step solutions with expert insights and AI powered tools for academic success
Step: 2

Step: 3
Ace Your Homework with AI
Get the answers you need in no time with our AI-driven, step-by-step assistance
Get Started
College Accounting A Practical Approach
Authors: Jeffrey Slater
12th edition
978-0132772068, 133468100, 013277206X, 9780133468106, 978-0133133233