1. Assume the Free Cash Flow in 2001 and 2002 is equal to Net Income to simplify the calculation.

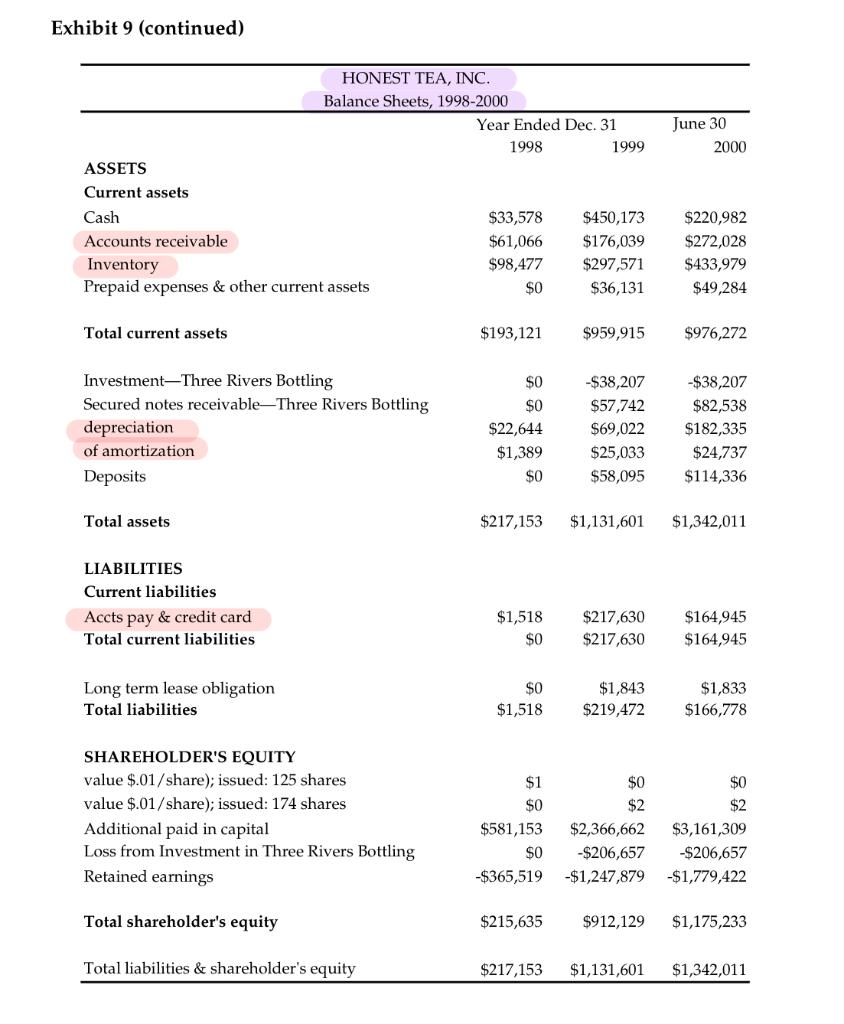
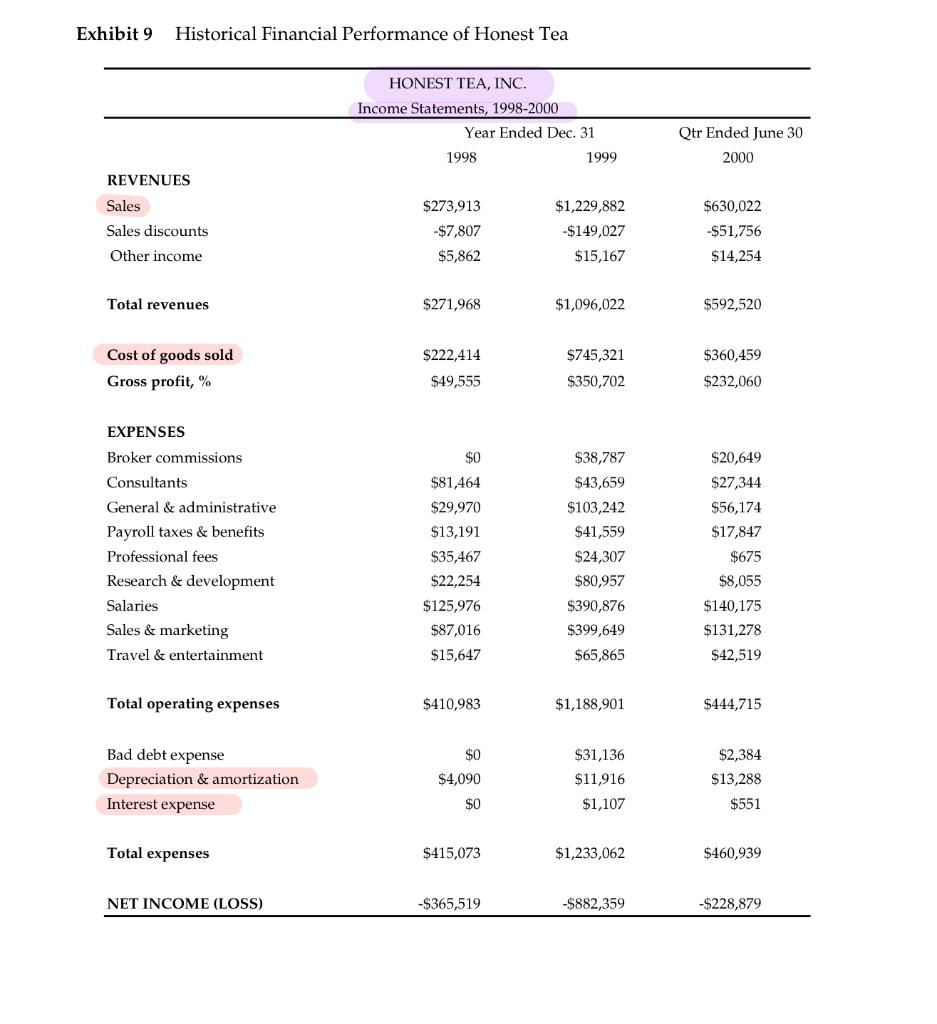
Exhibit 9 (continued) June 30 2000 HONEST TEA, INC. Balance Sheets, 1998-2000 Year Ended Dec. 31 1998 1999 ASSETS Current assets Cash $33,578 $450,173 Accounts receivable $61,066 $176,039 Inventory $98,477 $297,571 Prepaid expenses & other current assets $0 $36,131 $220,982 $272,028 $433,979 $49,284 Total current assets $193,121 $959,915 $976,272 $0 Investment-Three Rivers Bottling Secured notes receivable-Three Rivers Bottling depreciation of amortization Deposits $0 $22,644 $1,389 $0 $38,207 $57,742 $69,022 $25,033 $58,095 -$38,207 $82,538 $182,335 $24,737 $114,336 Total assets $217,153 $1,131,601 $1,342,011 LIABILITIES Current liabilities Accts pay & credit card Total current liabilities $1,518 $0 $217,630 $217,630 $164,945 $164,945 Long term lease obligation Total liabilities SO $1,518 $1,843 $219,472 $1,833 $166,778 SHAREHOLDER'S EQUITY value $.01/share); issued: 125 shares value $.01/share); issued: 174 shares Additional paid in capital Loss from Investment in Three Rivers Bottling Retained earnings $1 $0 $581,153 $0 -$365,519 $0 $0 $2 $2 $2,366,662 $3,161,309 -$206,657 -$206,657 -$1,247,879 $1,779,422 Total shareholder's equity $215,635 $912,129 $1,175,233 Total liabilities & shareholder's equity $217,153 $1,131,601 $1,342,011 Exhibit 9 Historical Financial Performance of Honest Tea HONEST TEA, INC. Income Statements, 1998-2000 Year Ended Dec. 31 1998 1999 Qtr Ended June 30 2000 REVENUES Sales $630,022 $273,913 -$7,807 $5,862 $1,229,882 -$149,027 Sales discounts -$51,756 $14,254 Other income $15,167 Total revenues $271,968 $1,096,022 $592,520 Cost of goods sold Gross profit, % $222,414 $49,555 $745,321 $350,702 $360,459 $232,060 EXPENSES $38,787 Broker commissions Consultants General & administrative Payroll taxes & benefits Professional fees Research & development Salaries Sales & marketing Travel & entertainment $0 $81,464 $29,970 $13,191 $35,467 $22,254 $125,976 $87,016 $15,647 $43,659 $103,242 $41,559 $24,307 $80,957 $390,876 $399,649 $65,865 $20,649 $27,344 $56,174 $17,847 $675 $8,055 $140,175 $131,278 $42,519 Total operating expenses $410,983 $1,188,901 $444,715 $0 Bad debt expense Depreciation & amortization Interest expense $4,090 $31,136 $11,916 $1,107 $2,384 $13,288 $551 $0 Total expenses $415,073 $1,233,062 $460,939 NET INCOME (LOSS) -$365,519 -$882,359 -$228,879 Exhibit 9 (continued) June 30 2000 HONEST TEA, INC. Balance Sheets, 1998-2000 Year Ended Dec. 31 1998 1999 ASSETS Current assets Cash $33,578 $450,173 Accounts receivable $61,066 $176,039 Inventory $98,477 $297,571 Prepaid expenses & other current assets $0 $36,131 $220,982 $272,028 $433,979 $49,284 Total current assets $193,121 $959,915 $976,272 $0 Investment-Three Rivers Bottling Secured notes receivable-Three Rivers Bottling depreciation of amortization Deposits $0 $22,644 $1,389 $0 $38,207 $57,742 $69,022 $25,033 $58,095 -$38,207 $82,538 $182,335 $24,737 $114,336 Total assets $217,153 $1,131,601 $1,342,011 LIABILITIES Current liabilities Accts pay & credit card Total current liabilities $1,518 $0 $217,630 $217,630 $164,945 $164,945 Long term lease obligation Total liabilities SO $1,518 $1,843 $219,472 $1,833 $166,778 SHAREHOLDER'S EQUITY value $.01/share); issued: 125 shares value $.01/share); issued: 174 shares Additional paid in capital Loss from Investment in Three Rivers Bottling Retained earnings $1 $0 $581,153 $0 -$365,519 $0 $0 $2 $2 $2,366,662 $3,161,309 -$206,657 -$206,657 -$1,247,879 $1,779,422 Total shareholder's equity $215,635 $912,129 $1,175,233 Total liabilities & shareholder's equity $217,153 $1,131,601 $1,342,011 Exhibit 9 Historical Financial Performance of Honest Tea HONEST TEA, INC. Income Statements, 1998-2000 Year Ended Dec. 31 1998 1999 Qtr Ended June 30 2000 REVENUES Sales $630,022 $273,913 -$7,807 $5,862 $1,229,882 -$149,027 Sales discounts -$51,756 $14,254 Other income $15,167 Total revenues $271,968 $1,096,022 $592,520 Cost of goods sold Gross profit, % $222,414 $49,555 $745,321 $350,702 $360,459 $232,060 EXPENSES $38,787 Broker commissions Consultants General & administrative Payroll taxes & benefits Professional fees Research & development Salaries Sales & marketing Travel & entertainment $0 $81,464 $29,970 $13,191 $35,467 $22,254 $125,976 $87,016 $15,647 $43,659 $103,242 $41,559 $24,307 $80,957 $390,876 $399,649 $65,865 $20,649 $27,344 $56,174 $17,847 $675 $8,055 $140,175 $131,278 $42,519 Total operating expenses $410,983 $1,188,901 $444,715 $0 Bad debt expense Depreciation & amortization Interest expense $4,090 $31,136 $11,916 $1,107 $2,384 $13,288 $551 $0 Total expenses $415,073 $1,233,062 $460,939 NET INCOME (LOSS) -$365,519 -$882,359 -$228,879


