

Answered step by step
Verified Expert Solution
Question
1 Approved Answer
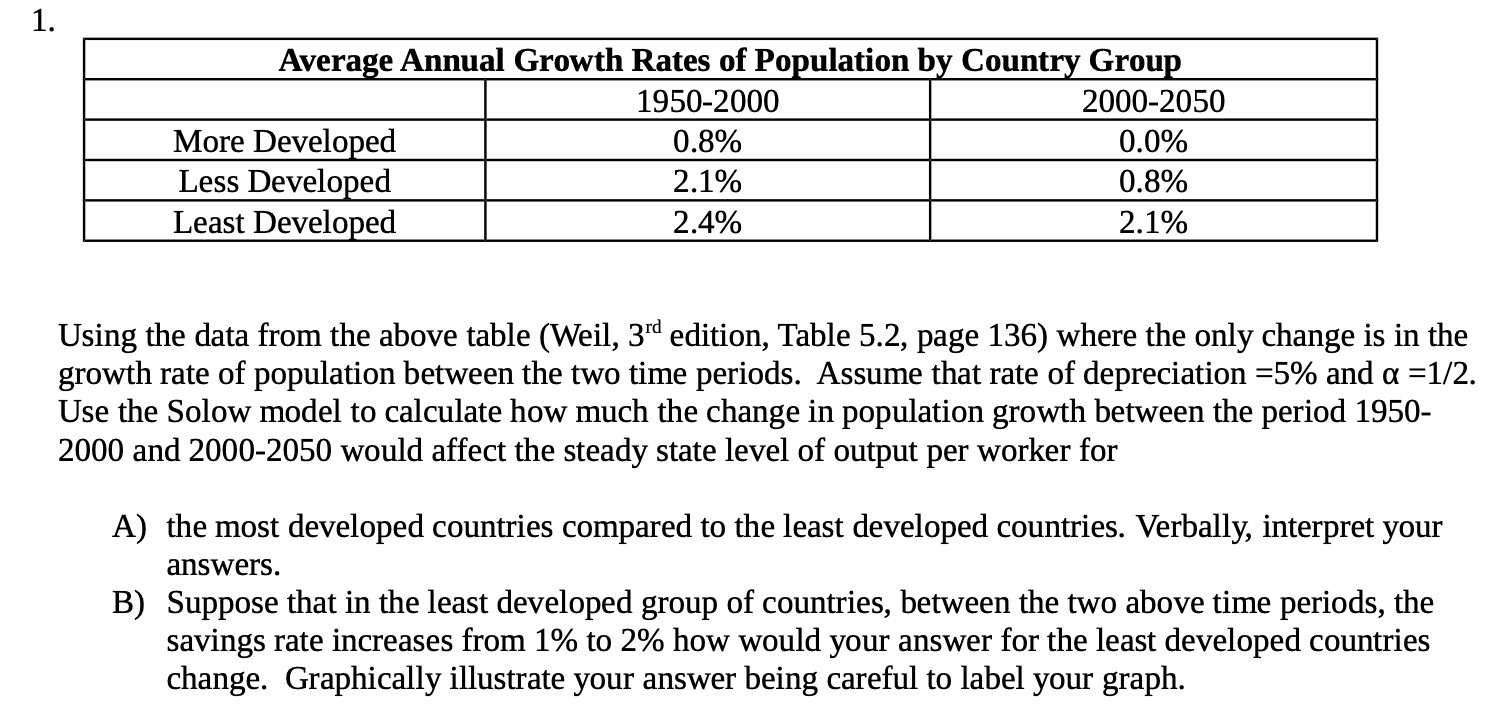
1. Average Annual Growth Rates of Population by Country Group 1950-2000 2000-2050 More Developed 0.8% 0.0% Less Developed 2.1% 0.8% Least Developed 2.4% 2.1% Using
Step by Step Solution
There are 3 Steps involved in it
Step: 1

Get Instant Access to Expert-Tailored Solutions
See step-by-step solutions with expert insights and AI powered tools for academic success
Step: 2

Step: 3
Ace Your Homework with AI
Get the answers you need in no time with our AI-driven, step-by-step assistance
Get Started
Elementary Algebra
Authors: Charles P McKeague
3rd Edition
1483263843, 9781483263847