1 b) answer choices: accept, reject, not reject.
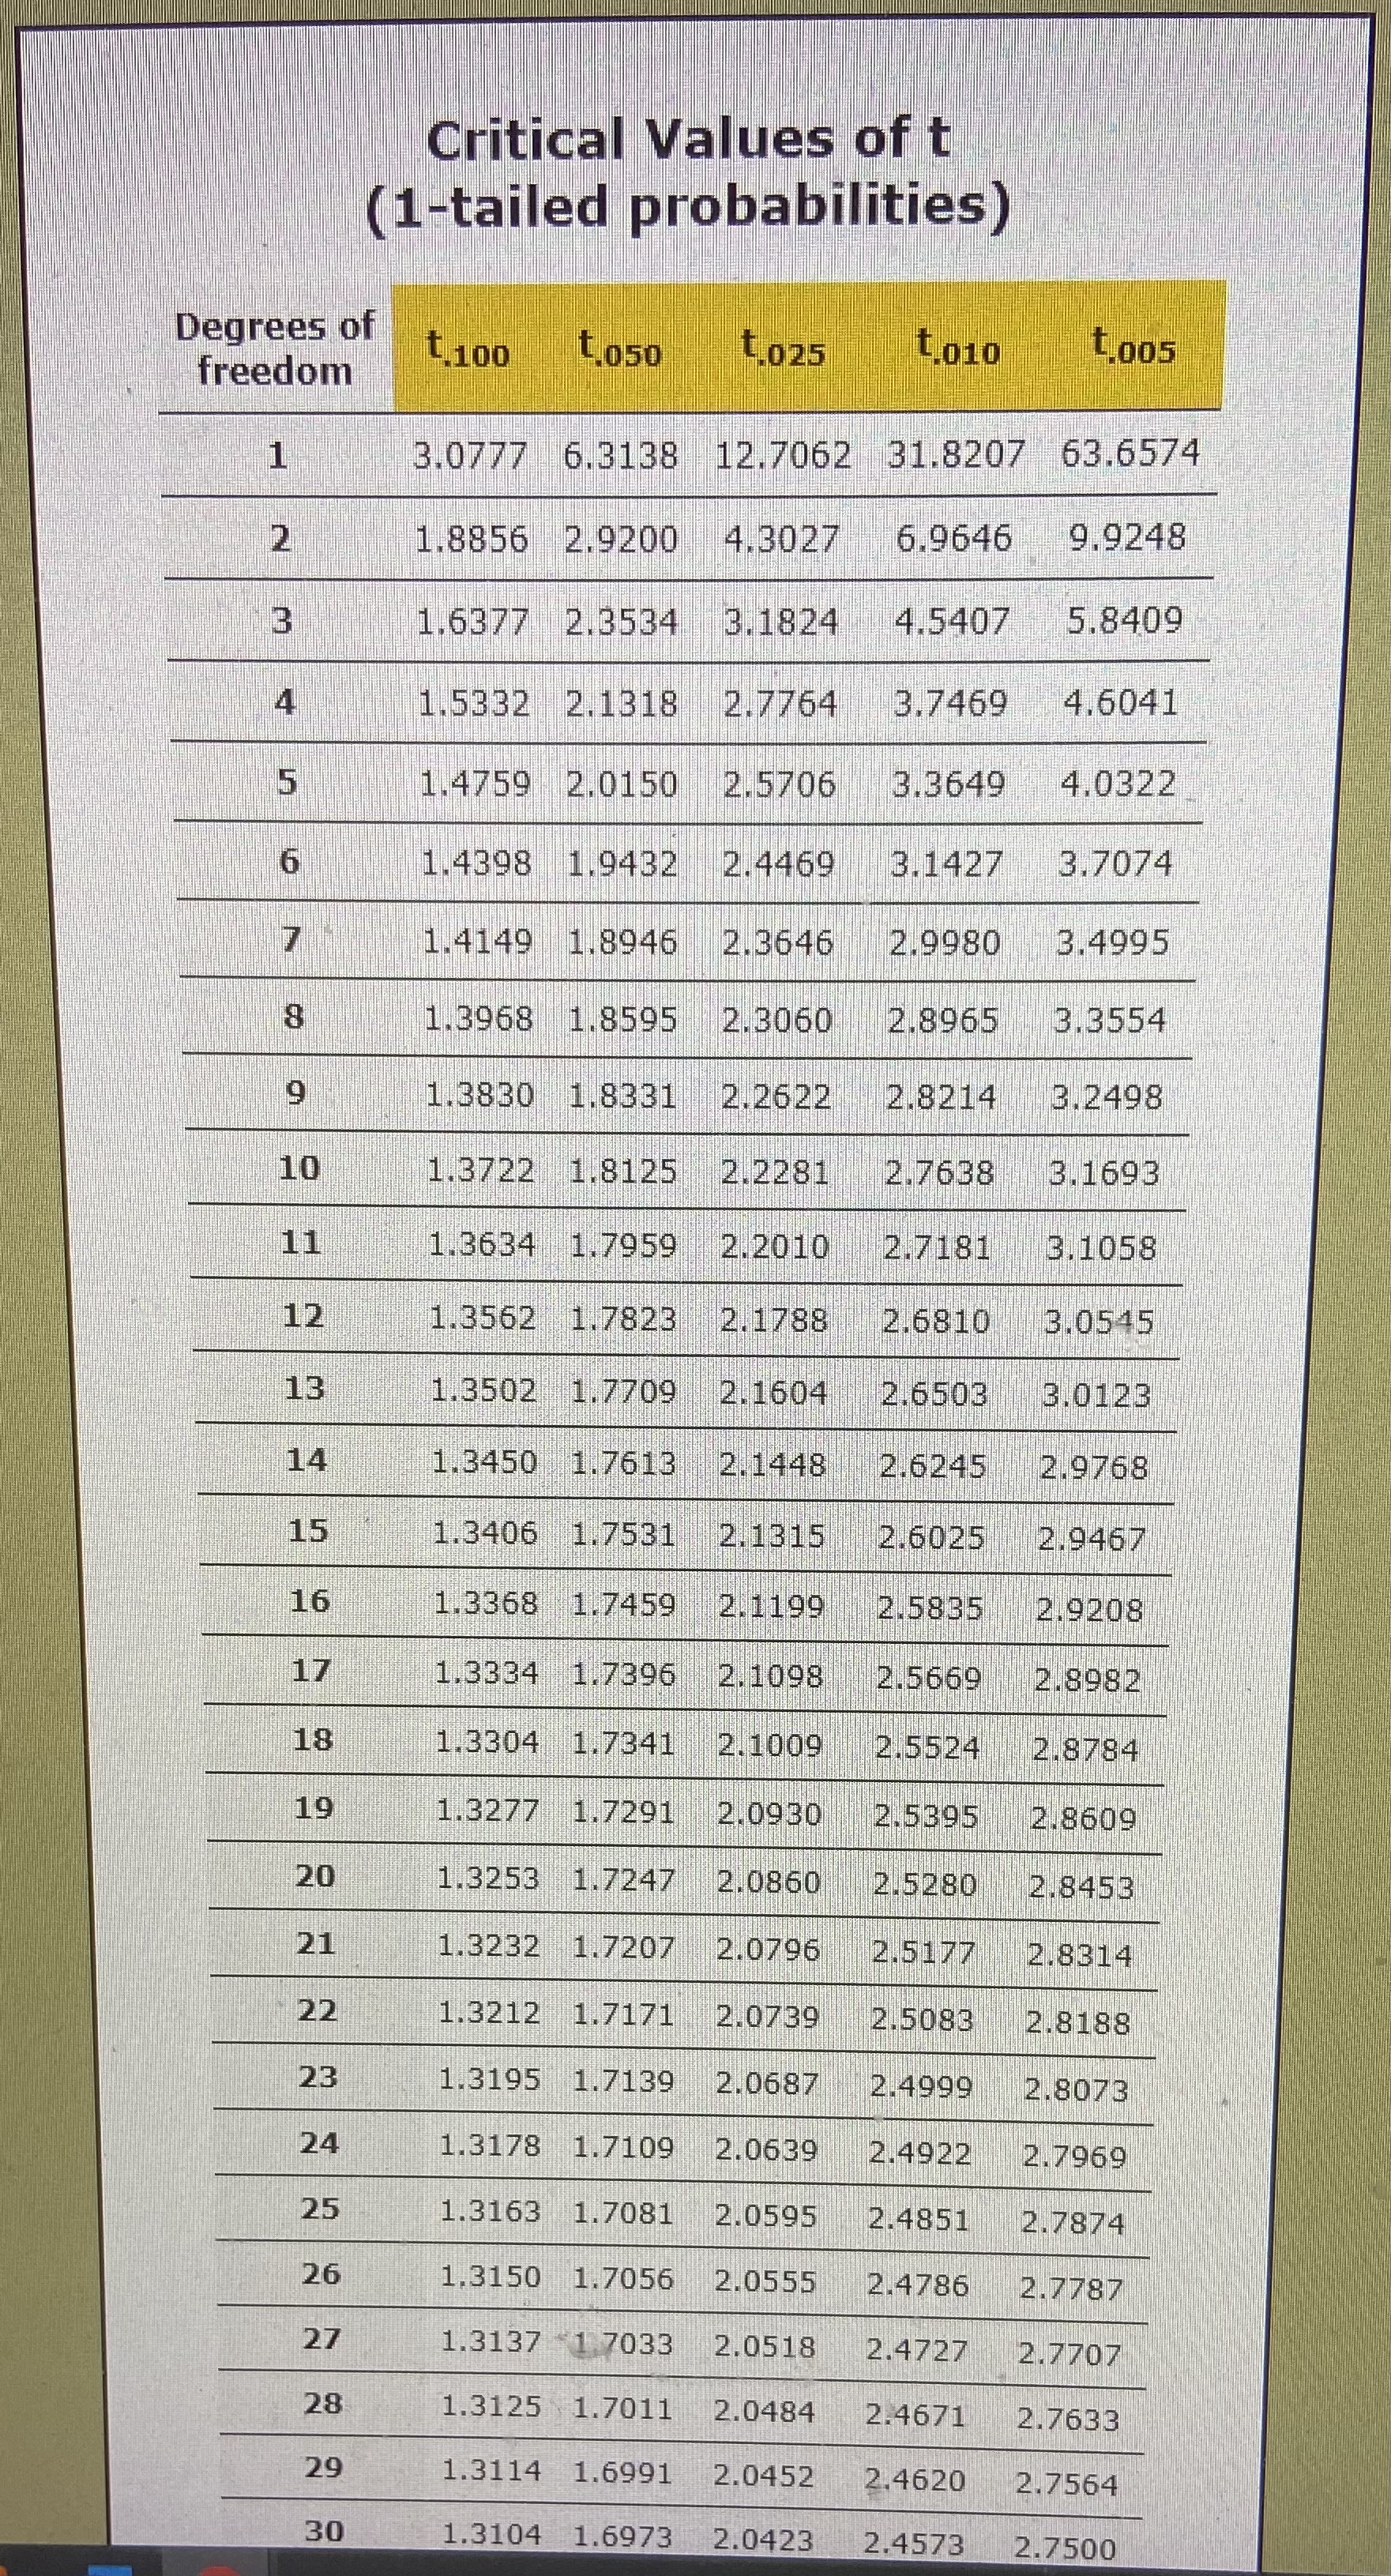
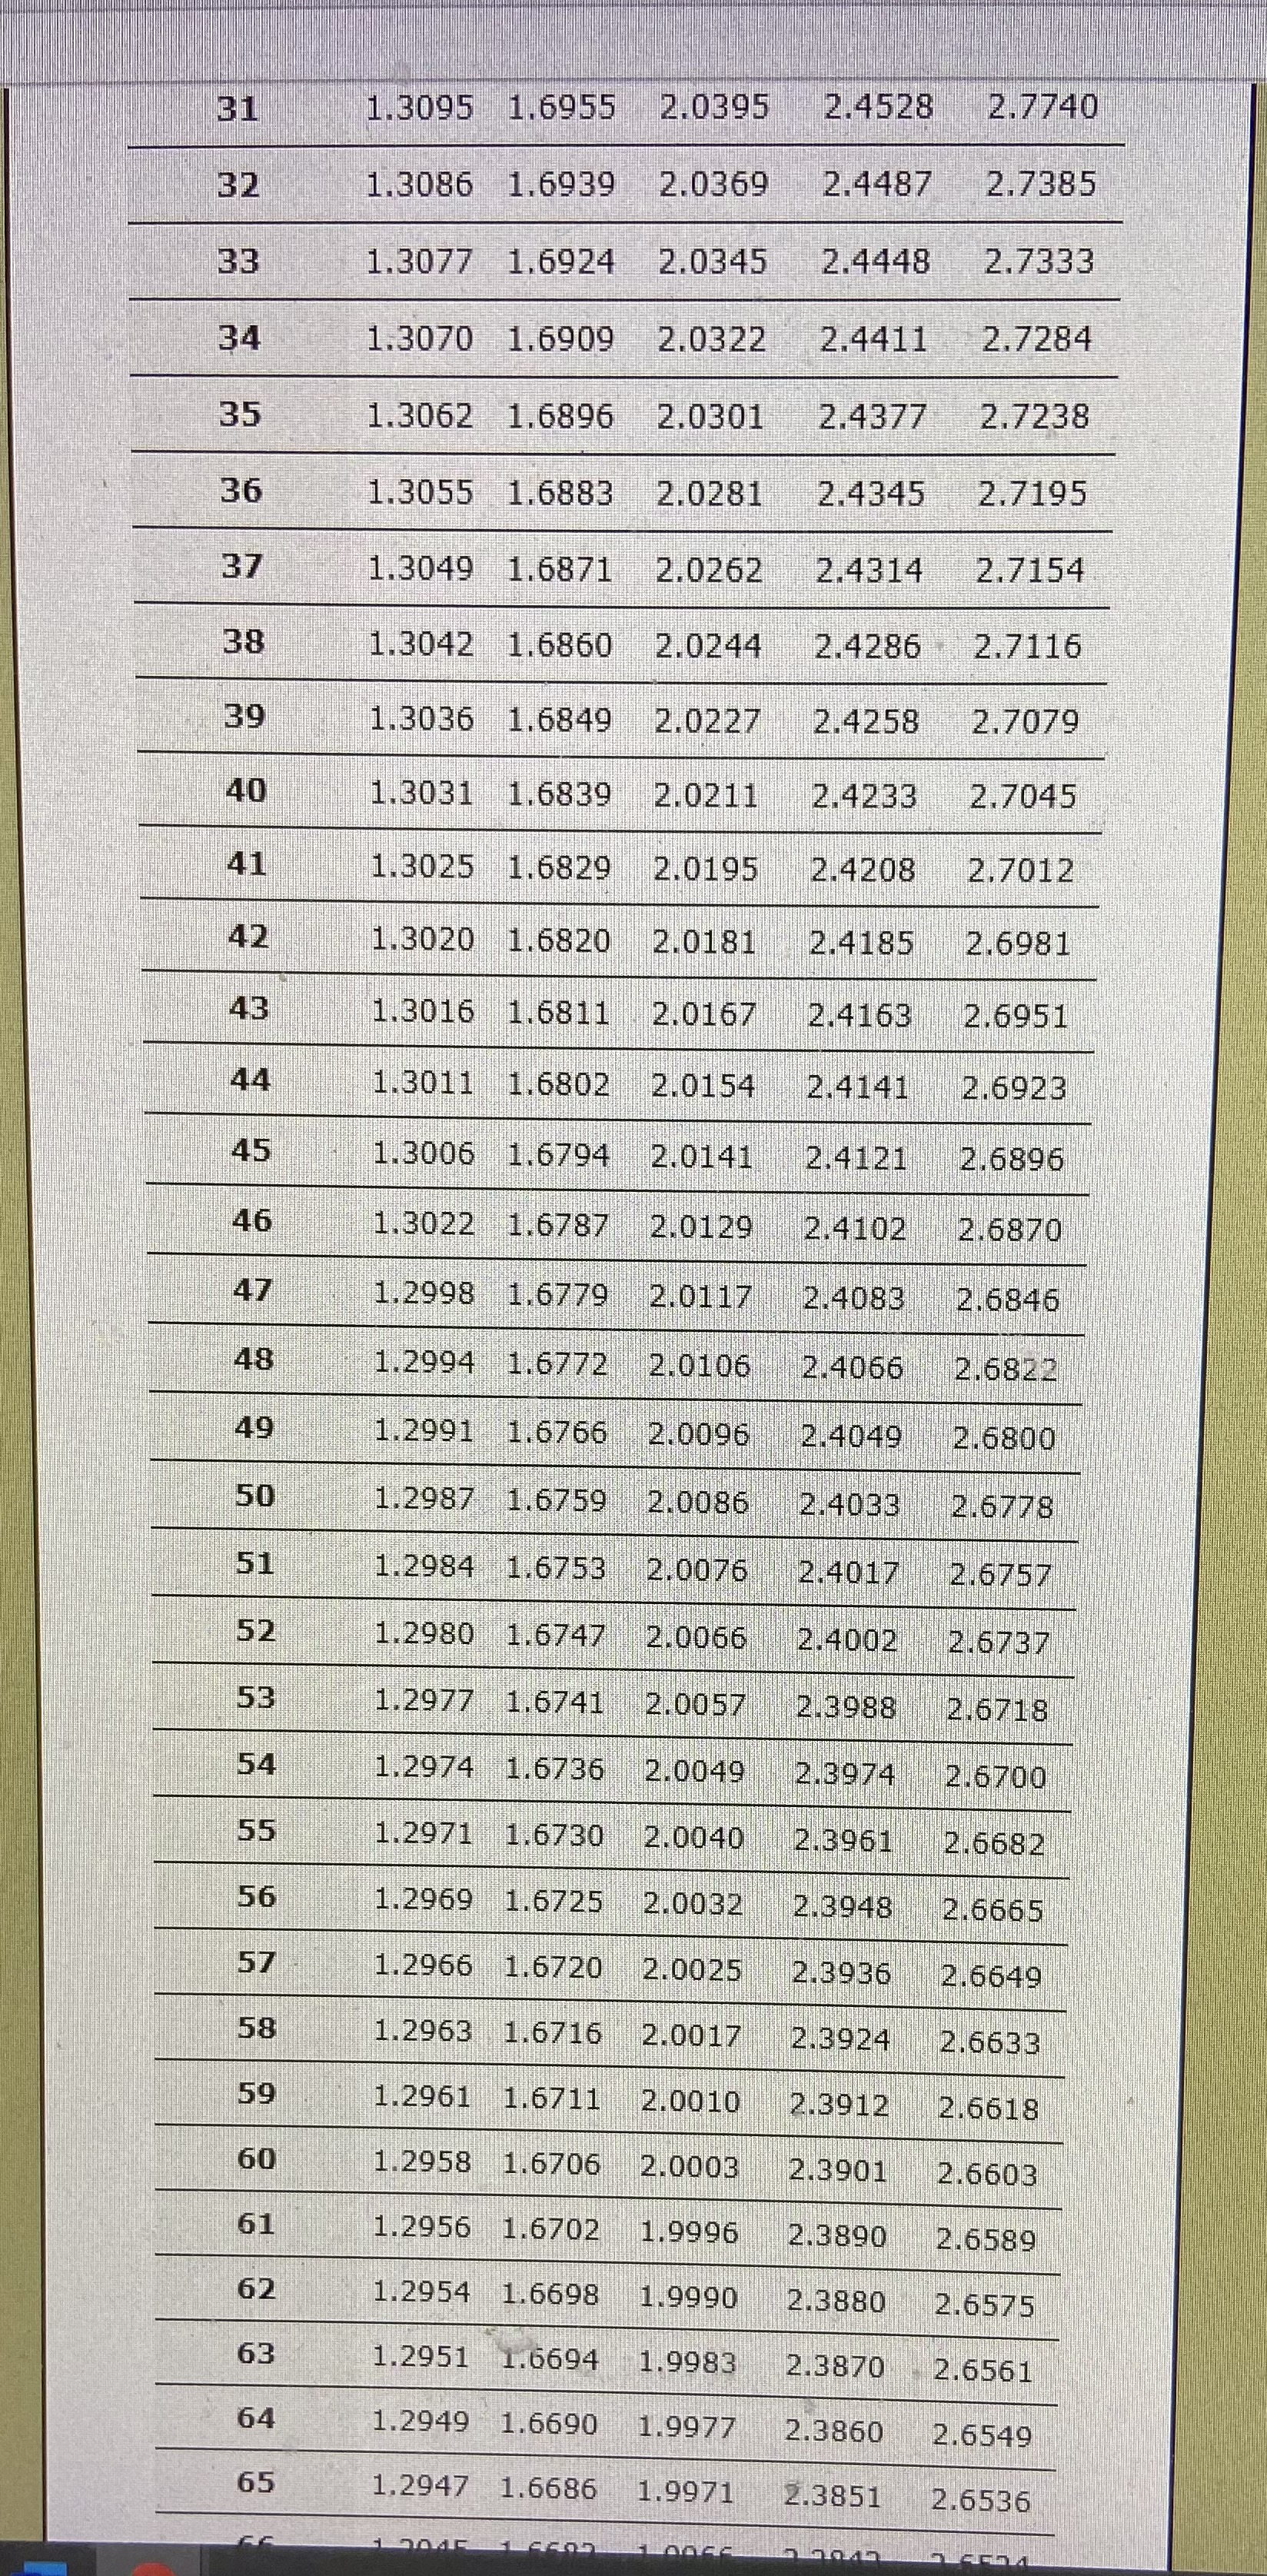
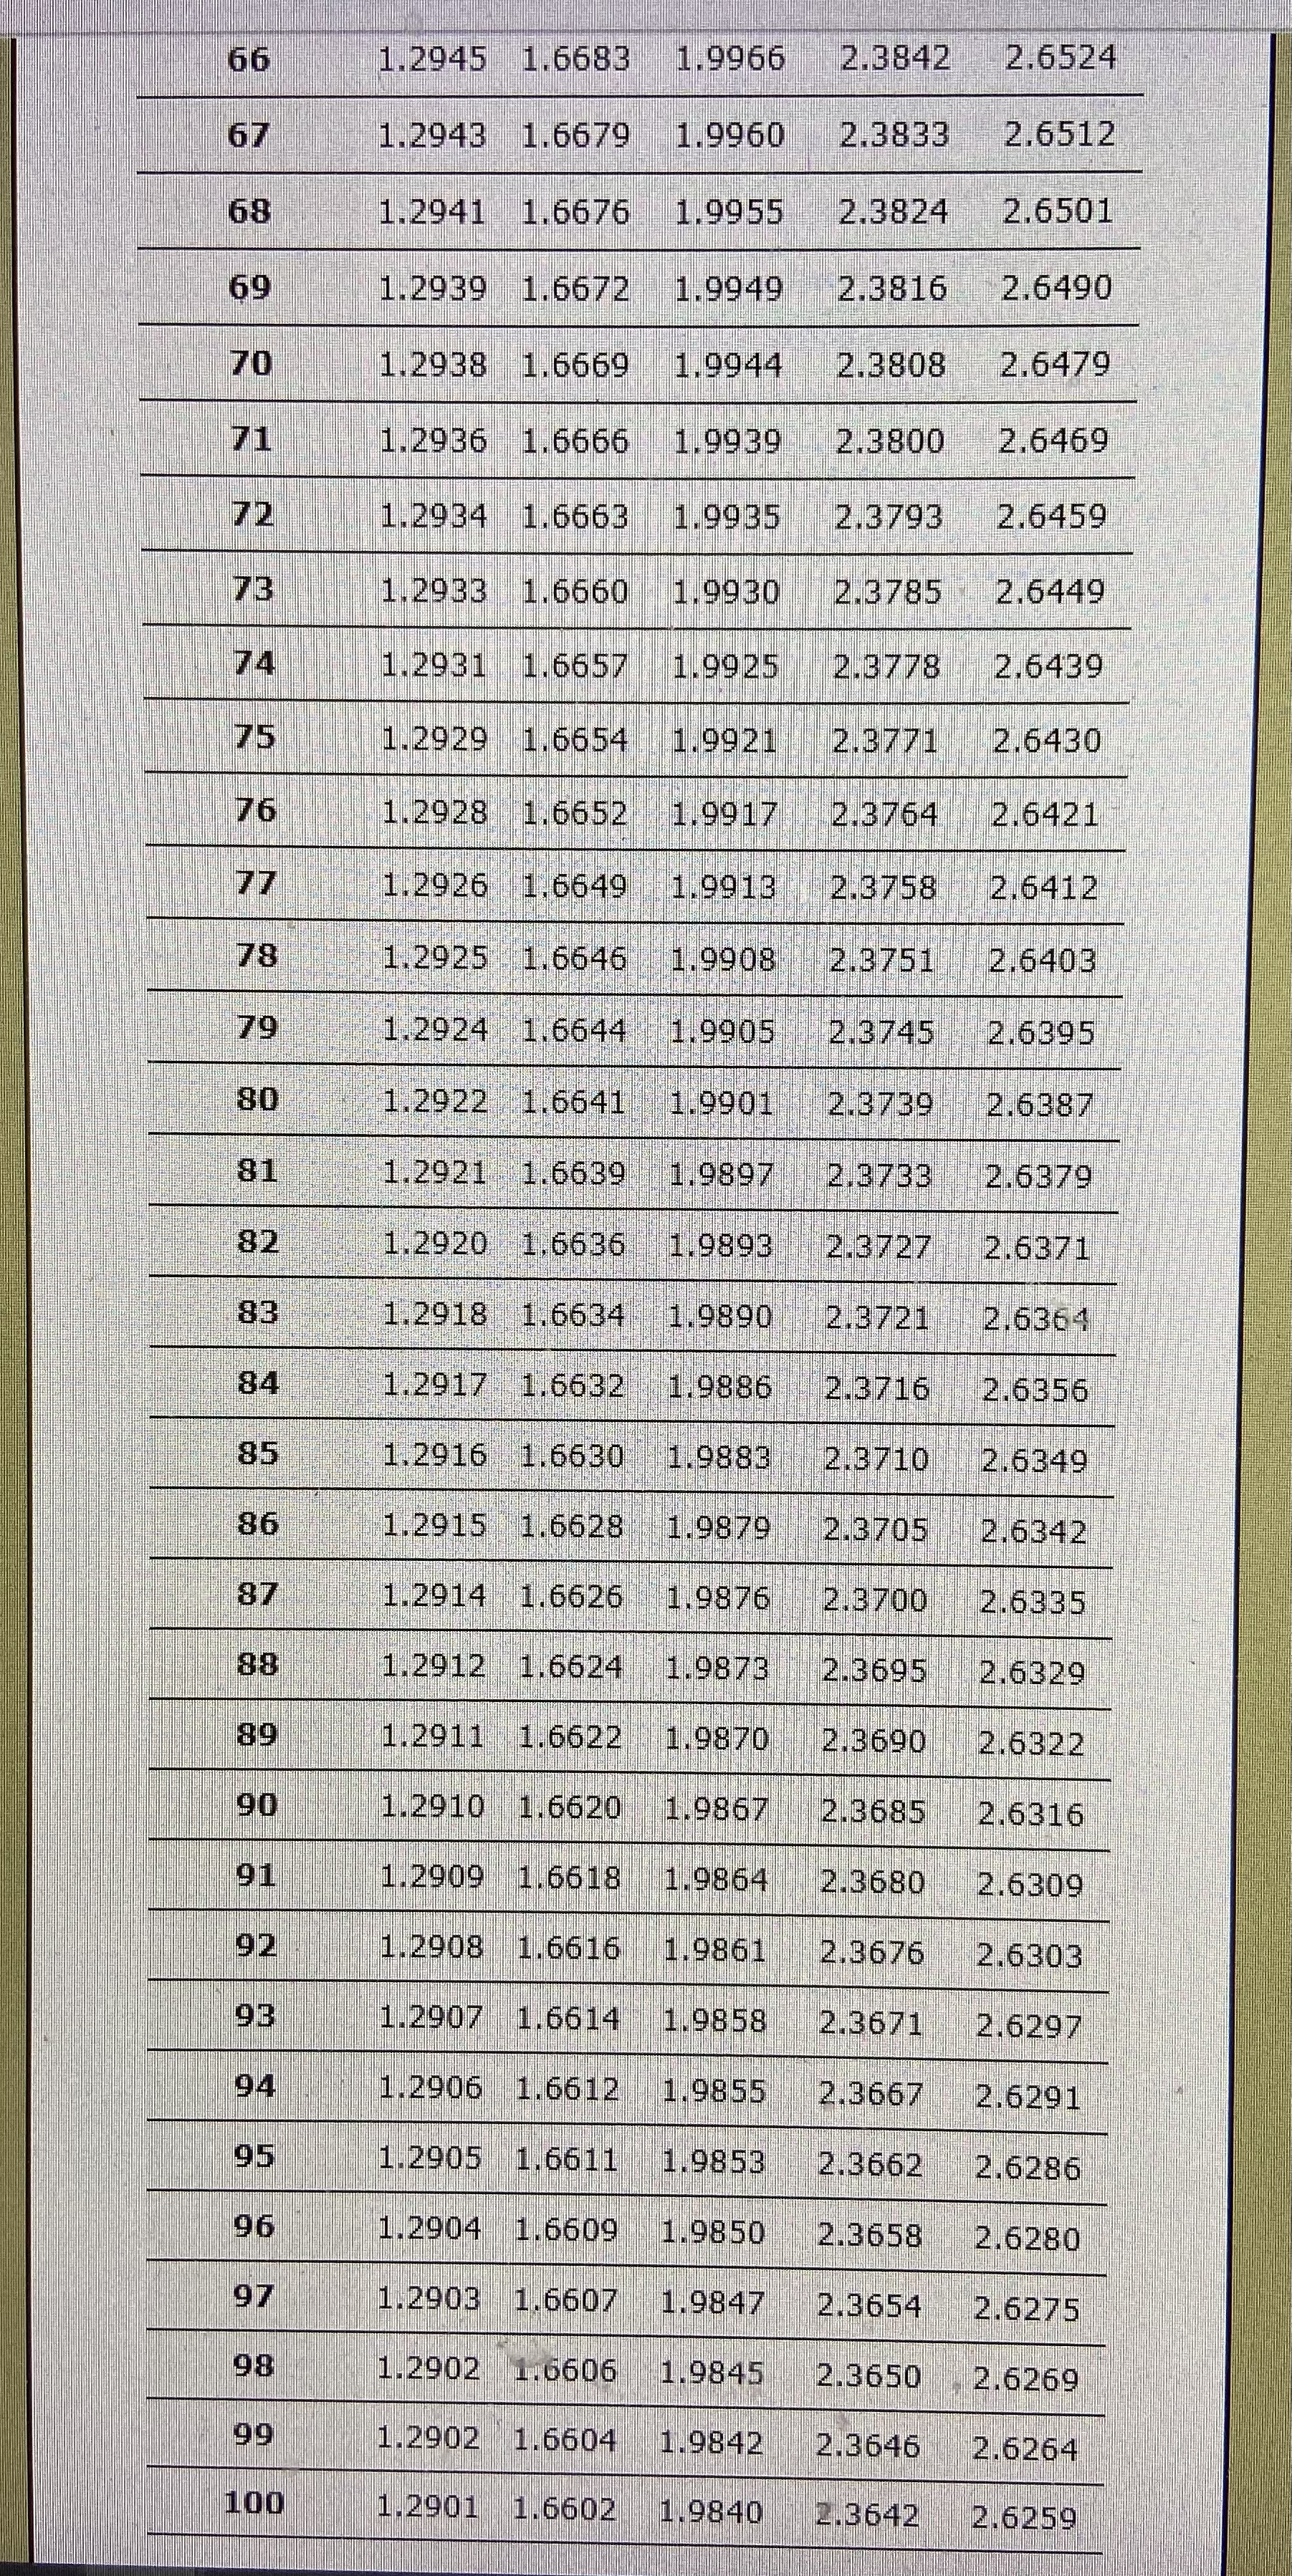
-1 of 2 ID: MST.FET.CP.ITPM.01.0010A [2 marks] Geoff is the proud owner of a restaurant. He is interested in determining whether his Wagyu beef or Hiramasa kingfish sashimi should be marketed as the Geoff Special. Geoff has selected a random sample of 20 people to taste his Wagyu beef and give it a score out of 100. He also selected a different random sample of 20 people to taste his Hiramasa kingfish sashimi and give it a score out of 100. The sample mean score given to the Wagyu beef dish was calculated as 72.67. The sample standard deviation of the scores for the Wagyu beef dish was calculated as 4. The sample mean score given to the Hiramasa kingfish sashimi dish was calculated as 77.84. The sample standard deviation of the scores for the Hiramasa kingfish sashimi dish was calculated as 4. The population standard deviations of the scores for each dish are unknown, but Geoff believes that it is reasonable to assume that they are equal. You may find this Student's t distribution table useful throughout the following questions. a) Geoff would like to test whether the mean scores of each of these dishes are equal. He has constructed a hypothesis test with Ho: Uw - UH and HA: Uw + HH- Calculate the test statistic (t) for this hypothesis test. Give your answer to 2 decimal places. b) Using the test statistic for Geoff's hypothesis test and a 95% confidence level, Geoff should the null hypothesis. 2 of 2 ID: MST.FET.CP.ITPM.02.0010A [2 marks] A study compared the individual pre-tax yearly income earned by residents from two states. The following table lists the statistics resulting from this study: Yearly Income Location Sample Size Sample Mean ($'000s) Sample Standard Deviation ($'000s) State A 51 114 17 State B 65 77 24 A part of the study involved calculating the upper and lower bound of the 95% confidence interval of the mean difference (State A - State B) between the income earned by individuals from the two states. For the purposes of this study, the simplified forumla for the number of degrees of freedom in the appropriate t-distribution will be used. Calculate the confidence interval. Give your answers to 2 decimal places. You may find this Student's t distribution table useful. a) Lower bound = b) Upper bound =\f31 1.3095 1.6955 2.0395 2.4528 2.7740 32 1.3086 1.6939 2.0369 2.4487 2.7385 33 1.3077 1.6924 2.0345 2.4448 2.7333 34 1.3070 1.6909 2.0322 2.4411 2.7284 35 1.3062 1.6896 2.0301 2.4377 2.7238 36 1.3055 1.6883 2.0281 2.4345 2.7195 37 1.3049 1.6871 2.0262 2.4314 2.7154 38 1.3042 1.6860 2.0244 2.4286 2.7116 39 1.3036 1.6849 2.0227 2.4258 2.7079 40 1.3031 1.6839 2.0211 2.4233 2.7045 41 1.3025 1.6829 2.0195 2.4208 2.7012 42 1.3020 1.6820 2.0181 2.4185 2.6981 43 1.3016 1.6811 2.0167 2.4163 2.6951 44 1.3011 1.6802 2.0154 2.4141 2.6923 45 1.3006 1.6794 2.0141 2.4121 2.6896 46 1.3022 1.6787 2.0129 2.4102 2.6870 47 1.2998 1.6779 2.0117 2.4083 2.6846 48 1.2994 1.6772 2.0106 2.4066 2.6822 49 1.2991 1.6766 2.0096 2.4049 2.6800 50 1.2987 1.6759 2.0086 2.4033 2.6778 51 1.2984 1.6753 2.0076 2.4017 2.6757 52 1.2980 1.6747 2.0066 2.4002 2.6737 53 1.2977 1.6741 2.0057 2.3988 2.6718 54 1.2974 1.6736 2.0049 2.3974 2.6700 55 1.2971 1.6730 2.0040 2.3961 2.6682 56 1.2969 1.6725 2.0032 2.3948 2.6665 57 1.2966 1.6720 2.0025 2.3936 2.6649 58 1.2963 1.6716 2.0017 2.3924 2.6633 59 1.2961 1.6711 2.0010 2.3912 2.6618 60 1.2958 1.6706 2.0003 2.3901 2.6603 61 1.2956 1.6702 1.9996 2.3890 2.6589 62 1.2954 1.6698 1.9990 2.3880 2.6575 63 1.2951 1.6694 1.9983 2.3870 2.6561 64 1.2949 1.6690 1.9977 2.3860 2.6549 65 1.2947 1.6686 1.9971 2.3851 2.653666 1.2945 1.6683 1.9966 2.3842 2.6524 67 1.2943 1.6679 1.9960 2.3833 2.6512 68 1.2941 1.6676 1.9955 2.3824 2.6501 69 1.2939 1.6672 1.9949 2.3816 2.6490 70 1.2938 1.6669 1.9944 2.3808 2.6479 71 1.2936 1.6666 1.9939 2.3800 2.6469 72 1.2934 1,6663 1.9935 2.3793 2.6459 73 1.2933 1.6660 1.9930 2.3785 2.6449 74 1.2931 1.6657 1.9925 2.3778 2.6439 75 1.2929 1.6654 1.9921 2.3771 2.6430 76 1.2928 1.6652 1.9917 2.3764 2.6421 77 1. 2926 1.6649 1.9913 2.3758 2.6412 78 1.2925 1.6646 1.9908 2.3751 2.6403 79 1.2924 1.6644 1.9905 2.3745 2.6395 80 1.2922 1.6641 1.9901 2.3739 2.6387 81 1.2921 1.6639 1.9897 2.3733 2.6379 82 1.2920 1,6636 1.9893 2.3727 2.6371 83 1.2918 1.6634 1.9890 2.3721 2.6364 84 1.2917 1.6632 1.9886 2.3716 2.6356 85 1.2916 1.6630 1.9883 2.3710 2.6349 86 1.2915 1.6628 1.9879 2.3705 2.6342 87 1.2914 1.6626 1.9876 2.3700 2.6335 88 1.2912 1.6624 1.9873 2.3695 2.6329 89 1.2911 1.6622 1.9870 2.3690 2.6322 90 1.2910 1.6620 1.9867 2.3685 2.6316 91 1.2909 1. 6618 1.9864 2.3680 2.6309 92 1.2908 1. 6616 1,9861 2.3676 2.6303 93 1.2907 1.6614 1.9858 2.3671 2.6297 94 1.2906 1.6612 1.9855 2.3667 2.6291 95 1.2905 1.6611 1.9853 2.3662 2.6286 96 1.2904 1.6609 1.9850 2.3658 2.6280 97 1.2903 1.6607 1.9847 2.3654 2.6275 98 1.2902 1. 6606 1.9845 2.3650 2.6269 99 1.2902 1.6604 1.9842 2.3646 2.6264 100 1.2901 1.6602 1.9840 2.3642 2.6259


