

Question
1. Based on financial reports prepare ratio analysis and interpret the result of the following ratios: Liquidity: Current Ratio, Quick Ratio Leverage: Debt to Total
1. Based on financial reports prepare ratio analysis and interpret the result of the following ratios:
- Liquidity: Current Ratio, Quick Ratio
- Leverage: Debt to Total Assets Ratio, Debt to Equity Ratio
- Profitability: Based on Sales, Based on Investment, and based on Market Ratios
----------------------------------
-------------------------------------------------------
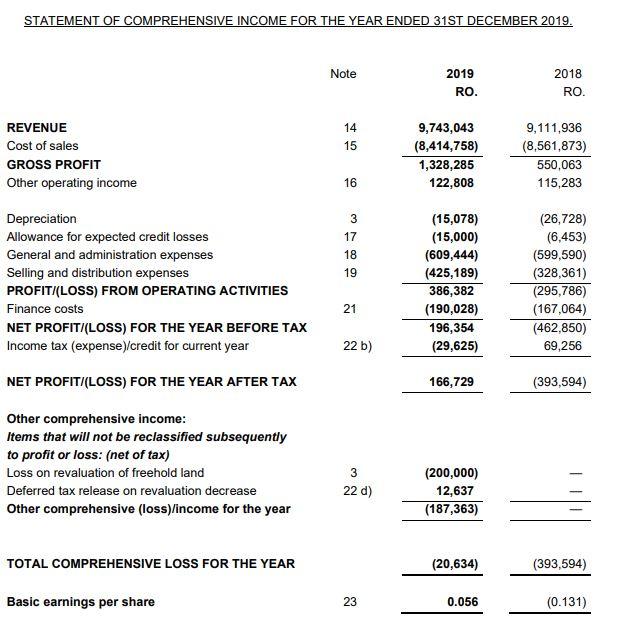
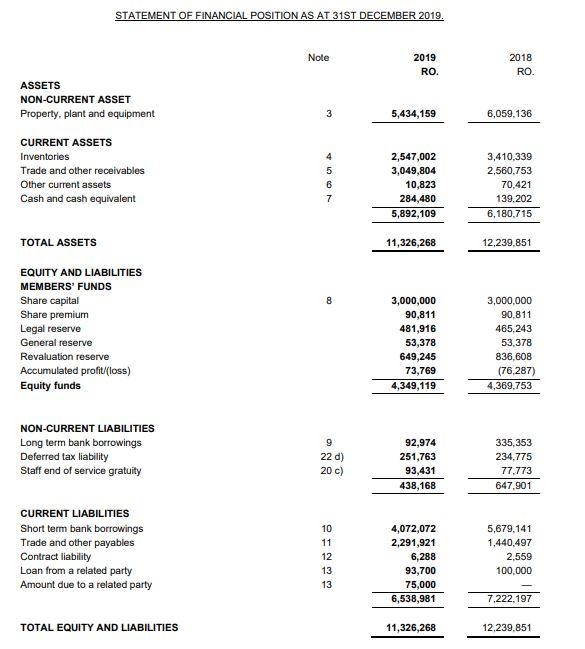
STATEMENT OF FINANCIAL POSITION AS AT 31ST DECEMBER 2019. Note 2019 RO. 2018 RO ASSETS NON-CURRENT ASSET Property, plant and equipment 3 5,434,159 6,059,136 CURRENT ASSETS Inventories Trade and other receivables Other current assets Cash and cash equivalent 4 5 O 2,547,002 3,049,804 10,823 284,480 5,892,109 3,410,339 2,560,753 70,421 139.202 6,180,715 7 TOTAL ASSETS 11,326,268 12,239.851 8 EQUITY AND LIABILITIES MEMBERS' FUNDS Share capital Share premium Legal reserve General reserve Revaluation reserve Accumulated profit/(loss) Equity funds 3,000,000 90,811 481,916 53,378 649,245 73,769 4,349,119 3,000,000 90,811 465,243 53,378 836,608 (76,287) 4,369,753 NON-CURRENT LIABILITIES Long term bank borrowings Deferred tax liability Staff end of service gratuity 9 22 d) 20 c) 92,974 251,763 93,431 438,168 335,353 234,775 77.773 647,901 CURRENT LIABILITIES Short term bank borrowings Trade and other payables Contract liability Loan from a related party Amount due to a related party 10 11 12 13 13 4,072,072 2,291,921 6,288 93,700 75,000 6,538,981 5,679,141 1,440,497 2,559 100.000 7.222,197 TOTAL EQUITY AND LIABILITIES 11,326,268 12,239.851 STATEMENT OF COMPREHENSIVE INCOME FOR THE YEAR ENDED 31ST DECEMBER 2019. Note 2019 RO. 2018 RO. 14 15 REVENUE Cost of sales GROSS PROFIT Other operating income 9,743,043 (8,414,758) 1,328,285 122,808 9,111,936 (8,561,873) 550,063 115,283 16 3 17 18 19 Depreciation Allowance for expected credit losses General and administration expenses Selling and distribution expenses PROFIT/(LOSS) FROM OPERATING ACTIVITIES Finance costs NET PROFIT/(LOSS) FOR THE YEAR BEFORE TAX Income tax (expense)/credit for current year (15,078) (15,000) (609,444) (425,189) 386,382 (190,028) 196,354 (29,625) (26,728) (6,453) (599,590) (328,361) (295,786) (167,064) (462,850) 69,256 21 22 b) NET PROFIT/(LOSS) FOR THE YEAR AFTER TAX 166,729 (393,594) Other comprehensive income: Items that will not be reclassified subsequently to profit or loss: (net of tax) Loss on revaluation of freehold land Deferred tax release on revaluation decrease Other comprehensive (loss)/income for the year 3 22 d) (200,000) 12,637 (187,363) TOTAL COMPREHENSIVE LOSS FOR THE YEAR (20,634) (393,594) Basic earnings per share 23 0.056 (0.131)
Step by Step Solution
There are 3 Steps involved in it
Step: 1

Get Instant Access to Expert-Tailored Solutions
See step-by-step solutions with expert insights and AI powered tools for academic success
Step: 2

Step: 3
Ace Your Homework with AI
Get the answers you need in no time with our AI-driven, step-by-step assistance
Get Started
Interne Revision In Verbundgruppen Und Franchise Systemen Verbreitung Und Qualit T Der Internen Revision In Unternehmensnetzwerken
Authors: Hans Ulrich Westhausen
1st. Aufl. 2016 Edition
3658121963, 978-3658121969