

Answered step by step
Verified Expert Solution
Question
1 Approved Answer
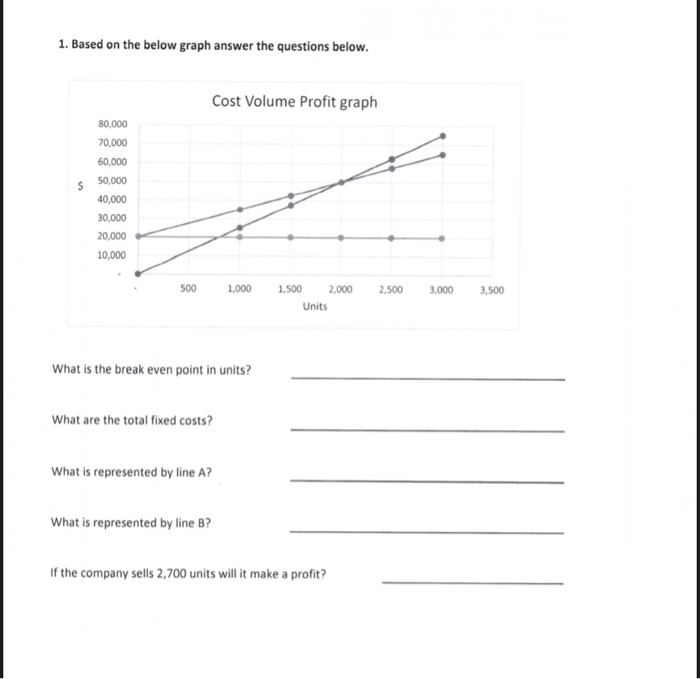
1. Based on the below graph answer the questions below. Cost Volume Profit graph $ 80,000 70,000 60,000 50,000 40,000 30,000 20,000 10,000 500 1.000
Step by Step Solution
There are 3 Steps involved in it
Step: 1

Get Instant Access to Expert-Tailored Solutions
See step-by-step solutions with expert insights and AI powered tools for academic success
Step: 2

Step: 3
Ace Your Homework with AI
Get the answers you need in no time with our AI-driven, step-by-step assistance
Get Started
Selected Chapters From Managerial Accounting Creating Value In A Dynamic Business Environment
Authors: Ronald W. Hilton
Edition
0073043346, 978-0073043340