

Answered step by step
Verified Expert Solution
Question
1 Approved Answer
1. Based on your analysis, recommend whether Gupta should include Bajaj Consumer Care Ltd. In his companys portfolio Analysis: K 8.5% 28.79 0.00% 92.4 34.8%
1. Based on your analysis, recommend whether Gupta should include Bajaj Consumer Care Ltd. In his companys portfolio
Analysis:
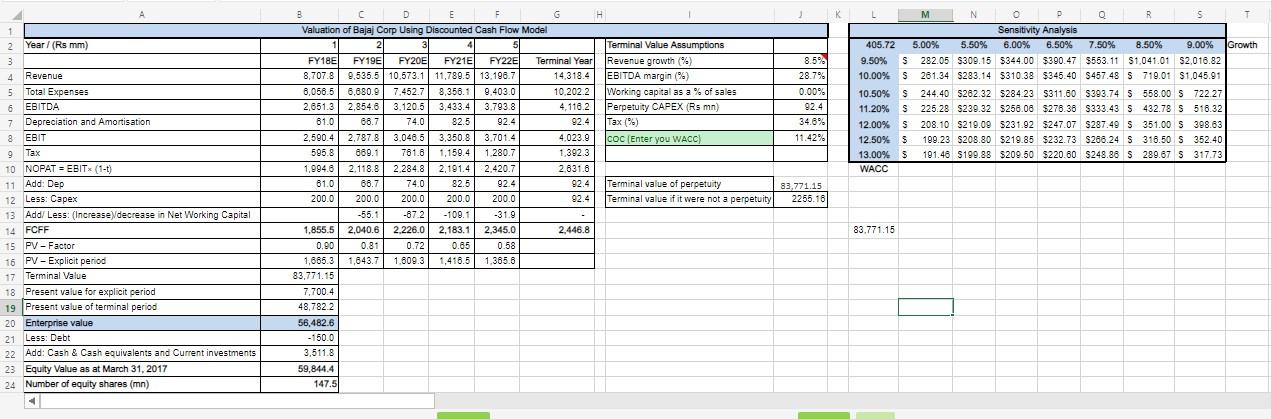
K 8.5% 28.79 0.00% 92.4 34.8% 11.42% L M N o D Q R S T Sensitivity Analysis 405.72 5.00% 5.50% 6.00% 6.50% 7.50% 8.50% 9.00% Growth 9.50% S 282.05 $309.15 $344.00 $390.47 $553.11 $1.041.01 52,018.82 10.00% $ 261.34 $283.14 $310.38 $345.40 $457.48 S 719.01 $1,045.91 10.50% $ 244.40 S282.32 $284.23 $311.80 $393.74 $ 558.00 S 722.27 % S 11.20% S225.28 $239.32 $250.08 $276.36 5333.43 S 432.78 S 516.32 12.00% S 208.10 $219.09 5231.92 $247.07 $287.49 S 351.00 S 398.63 12.50% $ 199.23 $208.80 $219.85 $232.73 $288.24 S 316.50 S 352.40 $ 13.00% $ 191.46 $199.88 $209.50 $220.60 S248.88 $ 289.67 S 317.73 WACC B C D E F G H H Valuation of Bajaj Corp Using Discounted Cash Flow Model 2 4 Terminal Value Assumptions FY18E FY19E FY20E FY21E FY22E Terminal Year Revenue growth (?) 8,707.8 9,535.5 10.573.1 11,789.5 13.196.7 14.318.4 EBITDA margin (%) 6,056.5 6,680.9 7,452.7 8,356.1 9.403.0 10.202.2 Working capital as a % of sales 2,651.3 2,854.8 3.120.5 3,433.4 3.793.8 4,116.2 Perpetuity CAPEX (Rs mn) 81.0 86.7 74.0 82.5 92.4 92.4 Tax (%) 2,590.4 2,787.8 3.048.5 3.350.8 3.7014 4,023.9 COC (Enter you WACC) 595.8 880.1 781.8 1.159.4 1.280.7 1,392.3 1,994.82.118.8 2.284.8 2,191.4 2.420.7 2.631.6 81.0 88.7 74.0 82.5 92.4 92.4 821 Terminal value of perpetuity 2000 200.0 200.0 200.0 200.0 92.4 Terminal value if it were not a perpetuity -55.1 -872 -109.1 -31.9 1.855.5 2,040.6 2.226.0 2.183.1 2,345.0 2.446.8 0.90 0.81 0.72 0.65 0.58 1,665.3 1,643.7 1.809.3 1,416.5 1.365.6 83,771.15 7,700.4 48.782.2 56,482.6 200 - 150.0 3,511.8 59,844.4 147.5 2 Year / (Rs mm) 3 4 Revenue 5 Total Expenses 6 EBITDA 7 Depreciation and Amortisation 8 EBIT Tax 9 9 lax 10 NOPAT = EBIT (1-1) 11 Add: Dep 12 Less: Capex 13 Add/ Less: (Increase decrease in Net Working Capital 14 FCFF 14 or 15 PV-Factor 16 PV - Explicit period 17 Terminal Value 18 Present value for explicit period 19 Present value of terminal period 20 Enterprise value 21 Less: Debt 22 Add: Cash & Cash equivalents and Current investments 23 Equity Value as at March 31, 2017 24 Number of equity shares (mn) 83,771.15 2255.16 83.771.15 K 8.5% 28.79 0.00% 92.4 34.8% 11.42% L M N o D Q R S T Sensitivity Analysis 405.72 5.00% 5.50% 6.00% 6.50% 7.50% 8.50% 9.00% Growth 9.50% S 282.05 $309.15 $344.00 $390.47 $553.11 $1.041.01 52,018.82 10.00% $ 261.34 $283.14 $310.38 $345.40 $457.48 S 719.01 $1,045.91 10.50% $ 244.40 S282.32 $284.23 $311.80 $393.74 $ 558.00 S 722.27 % S 11.20% S225.28 $239.32 $250.08 $276.36 5333.43 S 432.78 S 516.32 12.00% S 208.10 $219.09 5231.92 $247.07 $287.49 S 351.00 S 398.63 12.50% $ 199.23 $208.80 $219.85 $232.73 $288.24 S 316.50 S 352.40 $ 13.00% $ 191.46 $199.88 $209.50 $220.60 S248.88 $ 289.67 S 317.73 WACC B C D E F G H H Valuation of Bajaj Corp Using Discounted Cash Flow Model 2 4 Terminal Value Assumptions FY18E FY19E FY20E FY21E FY22E Terminal Year Revenue growth (?) 8,707.8 9,535.5 10.573.1 11,789.5 13.196.7 14.318.4 EBITDA margin (%) 6,056.5 6,680.9 7,452.7 8,356.1 9.403.0 10.202.2 Working capital as a % of sales 2,651.3 2,854.8 3.120.5 3,433.4 3.793.8 4,116.2 Perpetuity CAPEX (Rs mn) 81.0 86.7 74.0 82.5 92.4 92.4 Tax (%) 2,590.4 2,787.8 3.048.5 3.350.8 3.7014 4,023.9 COC (Enter you WACC) 595.8 880.1 781.8 1.159.4 1.280.7 1,392.3 1,994.82.118.8 2.284.8 2,191.4 2.420.7 2.631.6 81.0 88.7 74.0 82.5 92.4 92.4 821 Terminal value of perpetuity 2000 200.0 200.0 200.0 200.0 92.4 Terminal value if it were not a perpetuity -55.1 -872 -109.1 -31.9 1.855.5 2,040.6 2.226.0 2.183.1 2,345.0 2.446.8 0.90 0.81 0.72 0.65 0.58 1,665.3 1,643.7 1.809.3 1,416.5 1.365.6 83,771.15 7,700.4 48.782.2 56,482.6 200 - 150.0 3,511.8 59,844.4 147.5 2 Year / (Rs mm) 3 4 Revenue 5 Total Expenses 6 EBITDA 7 Depreciation and Amortisation 8 EBIT Tax 9 9 lax 10 NOPAT = EBIT (1-1) 11 Add: Dep 12 Less: Capex 13 Add/ Less: (Increase decrease in Net Working Capital 14 FCFF 14 or 15 PV-Factor 16 PV - Explicit period 17 Terminal Value 18 Present value for explicit period 19 Present value of terminal period 20 Enterprise value 21 Less: Debt 22 Add: Cash & Cash equivalents and Current investments 23 Equity Value as at March 31, 2017 24 Number of equity shares (mn) 83,771.15 2255.16 83.771.15
Step by Step Solution
There are 3 Steps involved in it
Step: 1

Get Instant Access to Expert-Tailored Solutions
See step-by-step solutions with expert insights and AI powered tools for academic success
Step: 2

Step: 3
Ace Your Homework with AI
Get the answers you need in no time with our AI-driven, step-by-step assistance
Get Started
The Traffic Trilogy Access To Millions Of Ultra Targeted Visitors For Pennies On The Dollar
Authors: Fred Lam
1st Edition
1530332788, 978-1530332786