

Answered step by step
Verified Expert Solution
Question
1 Approved Answer
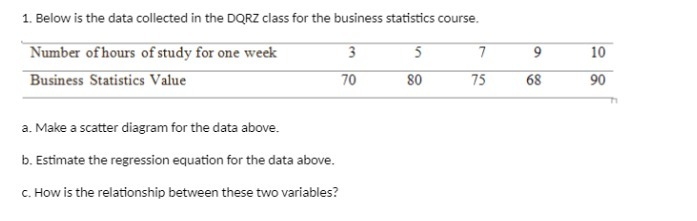
1. Below is the data collected in the DORZ class for the business statistics course. Number of hours of study for one week 5 7

Step by Step Solution
There are 3 Steps involved in it
Step: 1

Get Instant Access to Expert-Tailored Solutions
See step-by-step solutions with expert insights and AI powered tools for academic success
Step: 2

Step: 3
Ace Your Homework with AI
Get the answers you need in no time with our AI-driven, step-by-step assistance
Get Started
Interconnection Networks
Authors: J C Bermond
1st Edition
1483295273, 9781483295275