Answered step by step
Verified Expert Solution
Question
1 Approved Answer
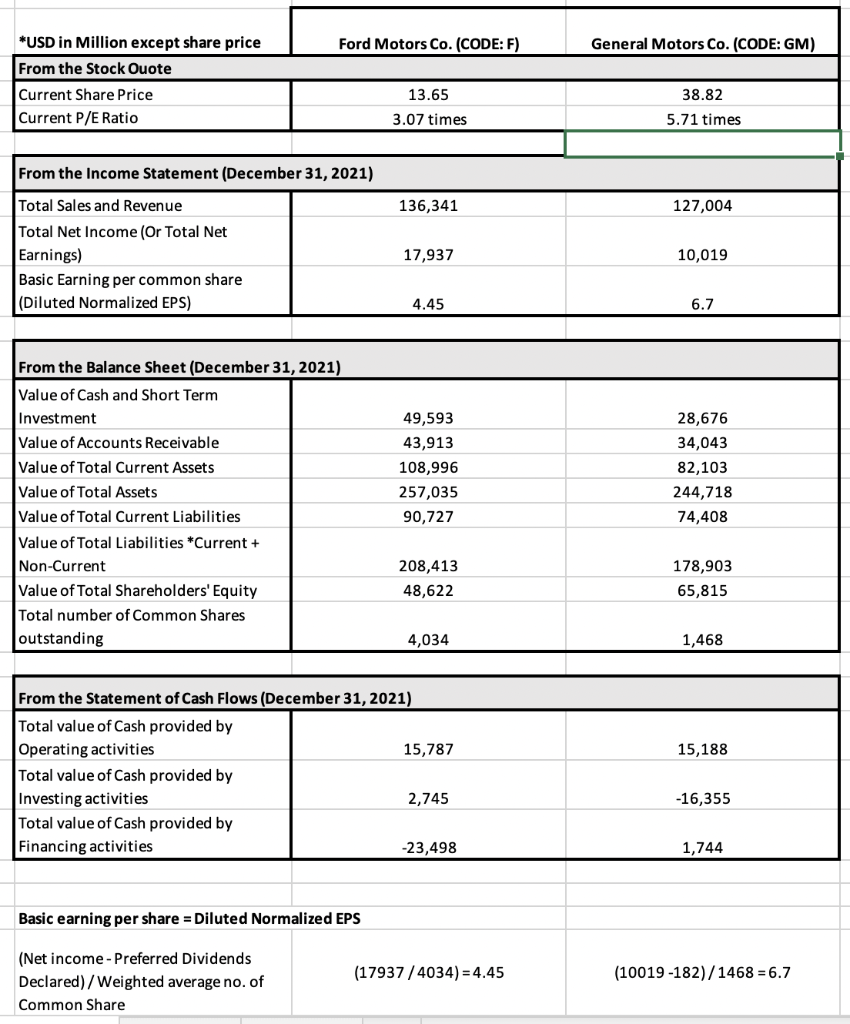
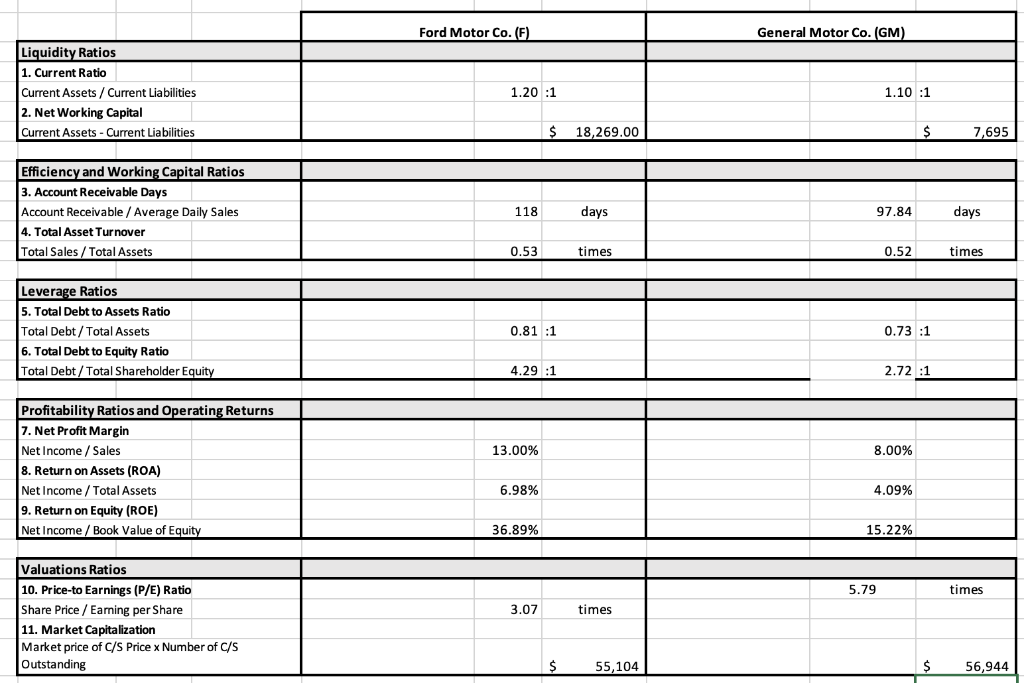
1. Briefly discuss each company's financial position, is it good or bad and explain why (based on the income statement and the profitability ratios)?


1. Briefly discuss each company's financial position, is it good or bad and explain why (based on the income statement and the profitability ratios)? 2. Discuss Ford Motor Co. and General Motor Co. ratios compared to each other. Which company does better in some areas or all areas? 3. Based on your analysis, select which company had the best financial performance for 2021 and support your conclusion. *USD in Million except share price From the Stock Quote Current Share Price Current P/E Ratio From the Income Statement (December 31, 2021) Total Sales and Revenue Total Net Income (Or Total Net Earnings) Basic Earning per common share (Diluted Normalized EPS) Ford Motors Co. (CODE: F) From the Balance Sheet (December 31, 2021) Value of Cash and Short Term Investment Value of Accounts Receivable Value of Total Current Assets Value of Total Assets Value of Total Current Liabilities Value of Total Liabilities *Current + Non-Current Value of Total Shareholders' Equity Total number of Common Shares outstanding Total value of Cash provided by Investing activities Total value of Cash provided by Financing activities 13.65 3.07 times Basic earning per share = Diluted Normalized EPS (Net income-Preferred Dividends Declared)/Weighted average no. of Common Share 136,341 17,937 4.45 49,593 43,913 108,996 257,035 90,727 From the Statement of Cash Flows (December 31, 2021) Total value of Cash provided by Operating activities 208,413 48,622 4,034 15,787 2,745 -23,498 (17937/4034) = 4.45 General Motors Co. (CODE: GM) 38.82 5.71 times 127,004 10,019 6.7 28,676 34,043 82,103 244,718 74,408 178,903 65,815 1,468 15,188 -16,355 1,744 (10019-182)/1468 = 6.7 Liquidity Ratios 1. Current Ratio Current Assets / Current Liabilities 2. Net Working Capital Current Assets - Current Liabilities Efficiency and Working Capital Ratios 3. Account Receivable Days Account Receivable / Average Daily Sales 4. Total Asset Turnover Total Sales/Total Assets Leverage Ratios 5. Total Debt to Assets Ratio Total Debt/Total Assets 6. Total Debt to Equity Ratio Total Debt/Total Shareholder Equity Profitability Ratios and Operating Returns 7. Net Profit Margin Net Income / Sales 8. Return on Assets (ROA) Net Income / Total Assets 9. Return on Equity (ROE) Net Income / Book Value of Equity Valuations Ratios 10. Price-to Earnings (P/E) Ratio Share Price/ Earning per Share 11. Market Capitalization Market price of C/S Price x Number of C/S Outstanding Ford Motor Co. (F) 1.20 :1 118 0.53 0.81 :1 4.29:1 13.00% 6.98% $ 36.89% 3.07 $ 18,269.00 days times times 55,104 General Motor Co. (GM) 1.10 :1 97.84 0.52 5.79 0.73 :1 8.00% 2.72 :1 4.09% $ 15.22% $ 7,695 days times times 56,944
Step by Step Solution
★★★★★
3.47 Rating (160 Votes )
There are 3 Steps involved in it
Step: 1
1 Financial Position Assessment Ford Motors Co F Profitability Net income of 1794 billion PE ratio o...
Get Instant Access to Expert-Tailored Solutions
See step-by-step solutions with expert insights and AI powered tools for academic success
Step: 2

Step: 3

Ace Your Homework with AI
Get the answers you need in no time with our AI-driven, step-by-step assistance
Get Started


