Answered step by step
Verified Expert Solution
Question
1 Approved Answer
1. Build a decision tree for the dataset shown in Figure 1. Note the first four columns are attributes, and the last column is the
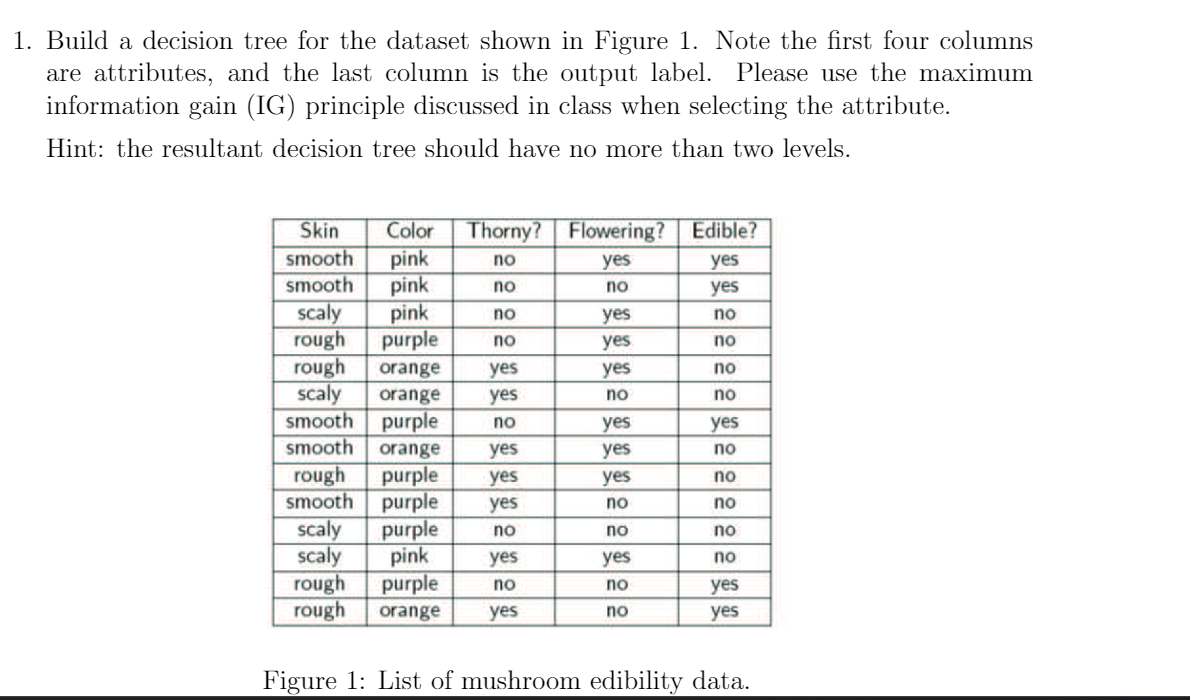
1. Build a decision tree for the dataset shown in Figure 1. Note the first four columns are attributes, and the last column is the output label. Please use the maximum information gain (IG) principle discussed in class when selecting the attribute. Hint: the resultant decision tree should have no more than two levels. Skin Color smooth pink smooth pink scaly pink rough purple rough orange scaly orange smooth purple smooth orange rough purple smooth purple scaly purple scaly pink rough purple rough orange Thorny? Flowering? Edible? no yes yes no no yes no yes no no yes no yes yes no yes no no no yes yes yes yes no yes yes no yes no no no no no yes yes no no no yes yes no yes Figure 1: List of mushroom edibility data. 1. Build a decision tree for the dataset shown in Figure 1. Note the first four columns are attributes, and the last column is the output label. Please use the maximum information gain (IG) principle discussed in class when selecting the attribute. Hint: the resultant decision tree should have no more than two levels. Skin Color smooth pink smooth pink scaly pink rough purple rough orange scaly orange smooth purple smooth orange rough purple smooth purple scaly purple scaly pink rough purple rough orange Thorny? Flowering? Edible? no yes yes no no yes no yes no no yes no yes yes no yes no no no yes yes yes yes no yes yes no yes no no no no no yes yes no no no yes yes no yes Figure 1: List of mushroom edibility data
Step by Step Solution
There are 3 Steps involved in it
Step: 1
Get Instant Access to Expert-Tailored Solutions
See step-by-step solutions with expert insights and AI powered tools for academic success
Step: 2
Step: 3
Ace Your Homework with AI
Get the answers you need in no time with our AI-driven, step-by-step assistance
Get Started