

Answered step by step
Verified Expert Solution
Question
1 Approved Answer
1. By using three estimates for each activity, find: 1.1. Estimated time te 1.2. Activity standard deviation s 2. Draw PERT network after calculating the
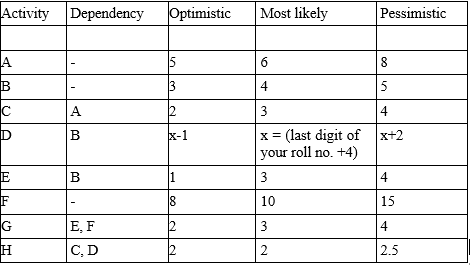 1. By using three estimates for each activity, find: 1.1. Estimated time te 1.2. Activity standard deviation s 2. Draw PERT network after calculating the events estimated times and standard deviations.
Step by Step Solution
There are 3 Steps involved in it
Step: 1

Get Instant Access to Expert-Tailored Solutions
See step-by-step solutions with expert insights and AI powered tools for academic success
Step: 2

Step: 3
Ace Your Homework with AI
Get the answers you need in no time with our AI-driven, step-by-step assistance
Get Started
Essential SQLAlchemy Mapping Python To Databases
Authors: Myers, Jason Myers
2nd Edition
1491916567, 9781491916568