 1. Calculate American Eagle's return on assets ratio (as a percentage) for the year ending February 3, 2018 (round to one decimal place).
2. How much did American Eagle expect to collect from customers as of February 3, 2018?
3. What amount of goods were returned to American Eagle during the year ended February 3, 2018?
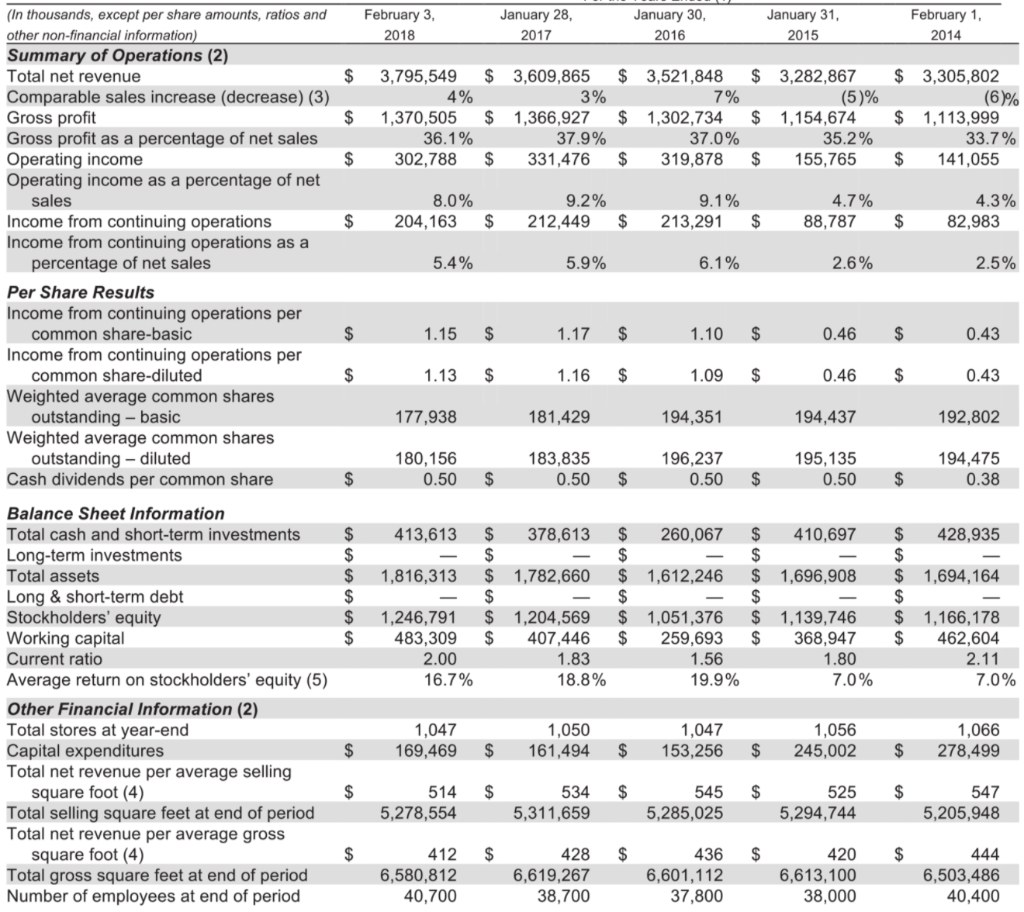
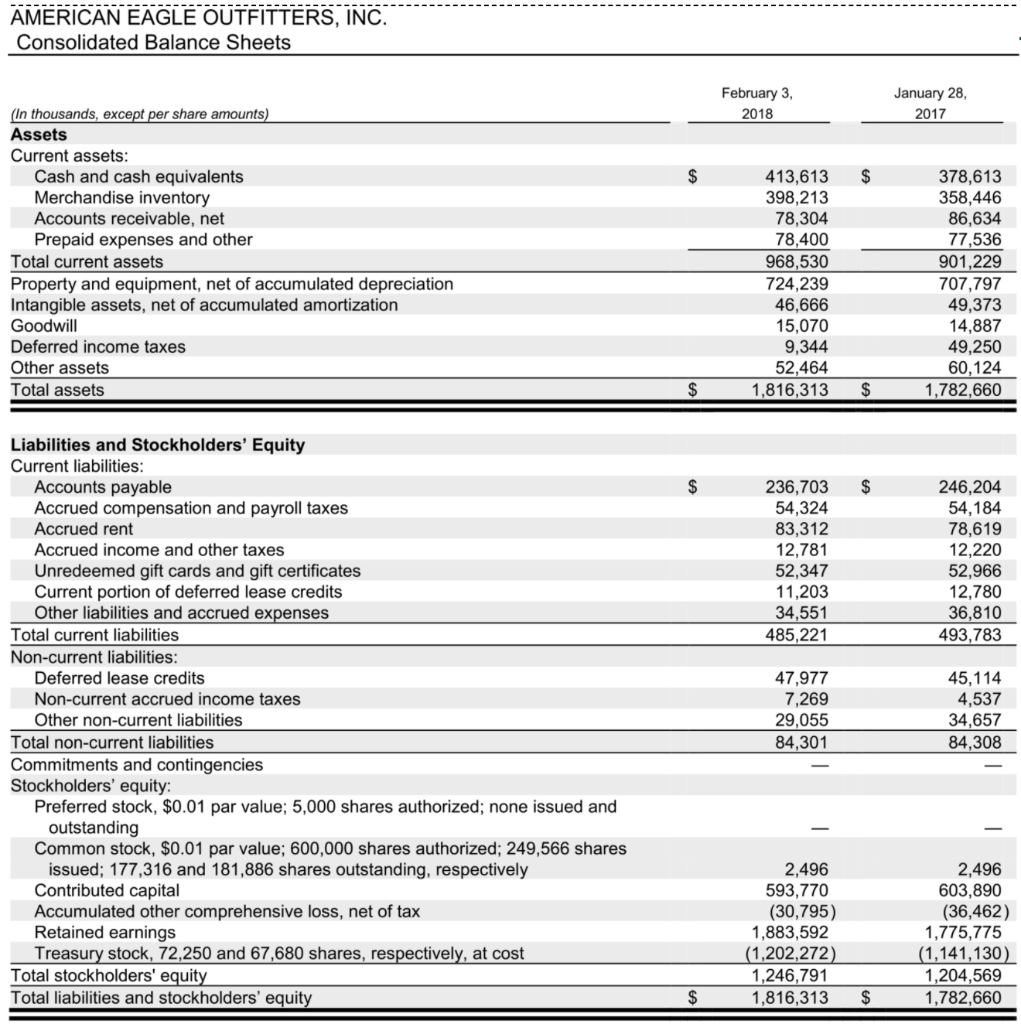
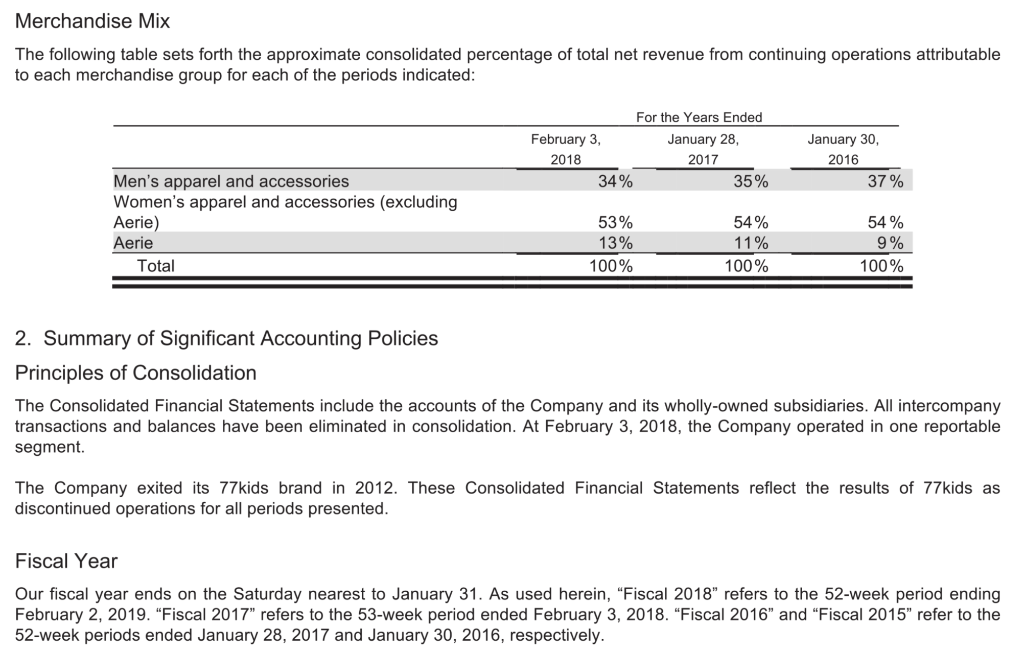
Merchandise Mix The following table sets forth the approximate consolidated percentage of total net revenue from continuing operations attributable to each merchandise group for each of the periods indicated: For the Years Ended February 3, January 28, 2018 2017 34% 35% January 30, 2016 37 % Men's apparel and accessories Women's apparel and accessories (excluding Aerie) Aerie Total 53% 13% 100% 54% 11% 100% 54% 9% 100% 2. Summary of Significant Accounting Policies Principles of Consolidation The Consolidated Financial Statements include the accounts of the Company and its wholly-owned subsidiaries. All intercompany transactions and balances have been eliminated in consolidation. At February 3, 2018, the Company operated in one reportable segment The Company exited its 77kids brand in 2012. These Consolidated Financial Statements reflect the results of 77kids as discontinued operations for all periods presented. Fiscal Year Our fiscal year ends on the Saturday nearest to January 31. As used herein, "Fiscal 2018" refers to the 52-week period ending February 2, 2019. "Fiscal 2017" refers to the 53-week period ended February 3, 2018. "Fiscal 2016" and "Fiscal 2015" refer to the 52-week periods ended January 28, 2017 and January 30, 2016, respectively. February 3, 2018 January 28, 2017 January 30, 2016 January 31, 2015 February 1, 2014 $ 3,795,549 4% 7% $ 1,370,505 36.1% 302,788 $ 3,609,865 $ 3,521,848 3% $ 1,366,927 $ 1,302,734 37.9% 37.0% $ 331,476 $ 319,878 $ 3,282,867 (5)% $ 1,154,674 35.2% $ 155,765 $ 3,305,802 (6)% $ 1,113,999 33.7% $ 141,055 $ 8.0% 204,163 9.2% 212,449 9.1% 213,291 4.7% 88,787 4.3% 82,983 $ $ $ $ $ (In thousands, except per share amounts, ratios and other non-financial information) Summary of Operations (2) Total net revenue Comparable sales increase (decrease) (3) Gross profit Gross profit as a percentage of net sales Operating income Operating income as a percentage of net sales Income from continuing operations Income from continuing operations as a percentage of net sales Per Share Results Income from continuing operations per common share-basic Income from continuing operations per common share-diluted Weighted average common shares outstanding - basic Weighted average common shares outstanding - diluted Cash dividends per common share 5.4% 5.9% 6.1% 2.6% 2.5% $ 1.15 $ 1.17 $ 1.10 $ 0.46 $ 0.43 $ 1.13 $ 1.16 $ 1.09 $ 0.46 $ 0.43 177,938 181,429 194,351 194,437 192,802 180, 156 0.50 183,835 0.50 196,237 0.50 195, 135 0.50 194,475 0.38 $ $ $ $ $ 413,613 378,613 260,067 1,816,313 1,782,660 1,612,246 $ $ $ $ $ $ $ $ $ $ $ $ $ $ $ $ $ $ $ 410,697 $ $ 1,696,908 $ $ 1,139,746 $ 368,947 1.80 7.0% $ 428,935 $ $ 1,694,164 $ $ 1,166,178 $ 462,604 2.11 7.0% 1,246,791 483,309 2.00 16.7% 1,204,569 407,446 1.83 18.8% 1,051,376 259,693 1.56 19.9% Balance Sheet Information Total cash and short-term investments Long-term investments Total assets Long & short-term debt Stockholders' equity Working capital Current ratio Average return on stockholders' equity (5) Other Financial Information (2) Total stores at year-end Capital expenditures Total net revenue per average selling square foot (4) Total selling square feet at end of period Total net revenue per average gross square foot (4) Total gross square feet at end of period Number of employees at end of period 1.047 169,469 1,050 161,494 1,047 153,256 1,056 245,002 1,066 278,499 $ $ $ $ $ $ $ $ $ $ 514 5,278,554 534 5,311,659 545 5,285,025 525 5,294,744 547 5,205,948 $ $ $ $ $ 412 6,580,812 40,700 428 6,619,267 38,700 436 6,601,112 37,800 420 6,613,100 38,000 444 6,503,486 40,400 AMERICAN EAGLE OUTFITTERS, INC. Consolidated Balance Sheets February 3, January 28, 2017 2018 $ (In thousands, except per share amounts) Assets Current assets: Cash and cash equivalents Merchandise inventory Accounts receivable, net Prepaid expenses and other Total current assets Property and equipment, net of accumulated depreciation Intangible assets, net of accumulated amortization Goodwill Deferred income taxes Other assets Total assets 413,613 398,213 78,304 78,400 968,530 724,239 46,666 15,070 9,344 52,464 1,816,313 378,613 358,446 86,634 77,536 901,229 707,797 49,373 14,887 49,250 60,124 1,782,660 $ $ $ 236.703 54,324 83,312 12,781 52,347 11,203 34,551 485,221 246,204 54,184 78,619 12,220 52,966 12,780 36,810 493,783 Liabilities and Stockholders' Equity Current liabilities: Accounts payable Accrued compensation and payroll taxes Accrued rent Accrued income and other taxes Unredeemed gift cards and gift certificates Current portion of deferred lease credits Other liabilities and accrued expenses Total current liabilities Non-current liabilities: Deferred lease credits Non-current accrued income taxes Other non-current liabilities Total non-current liabilities Commitments and contingencies Stockholders' equity: Preferred stock, $0.01 par value; 5,000 shares authorized; none issued and outstanding Common stock, $0.01 par value; 600,000 shares authorized; 249,566 shares issued; 177,316 and 181,886 shares outstanding, respectively Contributed capital Accumulated other comprehensive loss, net of tax Retained earnings Treasury stock, 72,250 and 67,680 shares, respectively, at cost Total stockholders' equity Total liabilities and stockholders' equity 47,977 7,269 29,055 84,301 45,114 4,537 34,657 84,308 2,496 593,770 (30,795) 1,883,592 (1,202,272) 1,246,791 1,816,313 2,496 603,890 (36,462) 1,775,775 (1,141,130) 1,204,569 1,782,660 $ $ Merchandise Mix The following table sets forth the approximate consolidated percentage of total net revenue from continuing operations attributable to each merchandise group for each of the periods indicated: For the Years Ended February 3, January 28, 2018 2017 34% 35% January 30, 2016 37 % Men's apparel and accessories Women's apparel and accessories (excluding Aerie) Aerie Total 53% 13% 100% 54% 11% 100% 54% 9% 100% 2. Summary of Significant Accounting Policies Principles of Consolidation The Consolidated Financial Statements include the accounts of the Company and its wholly-owned subsidiaries. All intercompany transactions and balances have been eliminated in consolidation. At February 3, 2018, the Company operated in one reportable segment The Company exited its 77kids brand in 2012. These Consolidated Financial Statements reflect the results of 77kids as discontinued operations for all periods presented. Fiscal Year Our fiscal year ends on the Saturday nearest to January 31. As used herein, "Fiscal 2018" refers to the 52-week period ending February 2, 2019. "Fiscal 2017" refers to the 53-week period ended February 3, 2018. "Fiscal 2016" and "Fiscal 2015" refer to the 52-week periods ended January 28, 2017 and January 30, 2016, respectively. February 3, 2018 January 28, 2017 January 30, 2016 January 31, 2015 February 1, 2014 $ 3,795,549 4% 7% $ 1,370,505 36.1% 302,788 $ 3,609,865 $ 3,521,848 3% $ 1,366,927 $ 1,302,734 37.9% 37.0% $ 331,476 $ 319,878 $ 3,282,867 (5)% $ 1,154,674 35.2% $ 155,765 $ 3,305,802 (6)% $ 1,113,999 33.7% $ 141,055 $ 8.0% 204,163 9.2% 212,449 9.1% 213,291 4.7% 88,787 4.3% 82,983 $ $ $ $ $ (In thousands, except per share amounts, ratios and other non-financial information) Summary of Operations (2) Total net revenue Comparable sales increase (decrease) (3) Gross profit Gross profit as a percentage of net sales Operating income Operating income as a percentage of net sales Income from continuing operations Income from continuing operations as a percentage of net sales Per Share Results Income from continuing operations per common share-basic Income from continuing operations per common share-diluted Weighted average common shares outstanding - basic Weighted average common shares outstanding - diluted Cash dividends per common share 5.4% 5.9% 6.1% 2.6% 2.5% $ 1.15 $ 1.17 $ 1.10 $ 0.46 $ 0.43 $ 1.13 $ 1.16 $ 1.09 $ 0.46 $ 0.43 177,938 181,429 194,351 194,437 192,802 180, 156 0.50 183,835 0.50 196,237 0.50 195, 135 0.50 194,475 0.38 $ $ $ $ $ 413,613 378,613 260,067 1,816,313 1,782,660 1,612,246 $ $ $ $ $ $ $ $ $ $ $ $ $ $ $ $ $ $ $ 410,697 $ $ 1,696,908 $ $ 1,139,746 $ 368,947 1.80 7.0% $ 428,935 $ $ 1,694,164 $ $ 1,166,178 $ 462,604 2.11 7.0% 1,246,791 483,309 2.00 16.7% 1,204,569 407,446 1.83 18.8% 1,051,376 259,693 1.56 19.9% Balance Sheet Information Total cash and short-term investments Long-term investments Total assets Long & short-term debt Stockholders' equity Working capital Current ratio Average return on stockholders' equity (5) Other Financial Information (2) Total stores at year-end Capital expenditures Total net revenue per average selling square foot (4) Total selling square feet at end of period Total net revenue per average gross square foot (4) Total gross square feet at end of period Number of employees at end of period 1.047 169,469 1,050 161,494 1,047 153,256 1,056 245,002 1,066 278,499 $ $ $ $ $ $ $ $ $ $ 514 5,278,554 534 5,311,659 545 5,285,025 525 5,294,744 547 5,205,948 $ $ $ $ $ 412 6,580,812 40,700 428 6,619,267 38,700 436 6,601,112 37,800 420 6,613,100 38,000 444 6,503,486 40,400 AMERICAN EAGLE OUTFITTERS, INC. Consolidated Balance Sheets February 3, January 28, 2017 2018 $ (In thousands, except per share amounts) Assets Current assets: Cash and cash equivalents Merchandise inventory Accounts receivable, net Prepaid expenses and other Total current assets Property and equipment, net of accumulated depreciation Intangible assets, net of accumulated amortization Goodwill Deferred income taxes Other assets Total assets 413,613 398,213 78,304 78,400 968,530 724,239 46,666 15,070 9,344 52,464 1,816,313 378,613 358,446 86,634 77,536 901,229 707,797 49,373 14,887 49,250 60,124 1,782,660 $ $ $ 236.703 54,324 83,312 12,781 52,347 11,203 34,551 485,221 246,204 54,184 78,619 12,220 52,966 12,780 36,810 493,783 Liabilities and Stockholders' Equity Current liabilities: Accounts payable Accrued compensation and payroll taxes Accrued rent Accrued income and other taxes Unredeemed gift cards and gift certificates Current portion of deferred lease credits Other liabilities and accrued expenses Total current liabilities Non-current liabilities: Deferred lease credits Non-current accrued income taxes Other non-current liabilities Total non-current liabilities Commitments and contingencies Stockholders' equity: Preferred stock, $0.01 par value; 5,000 shares authorized; none issued and outstanding Common stock, $0.01 par value; 600,000 shares authorized; 249,566 shares issued; 177,316 and 181,886 shares outstanding, respectively Contributed capital Accumulated other comprehensive loss, net of tax Retained earnings Treasury stock, 72,250 and 67,680 shares, respectively, at cost Total stockholders' equity Total liabilities and stockholders' equity 47,977 7,269 29,055 84,301 45,114 4,537 34,657 84,308 2,496 593,770 (30,795) 1,883,592 (1,202,272) 1,246,791 1,816,313 2,496 603,890 (36,462) 1,775,775 (1,141,130) 1,204,569 1,782,660 $ $