

Question
1/ Calculate ratios for the pink shaded areas. Prior ratios are given. Use formulas. Using the ratios you calculated and other ratios provided in the
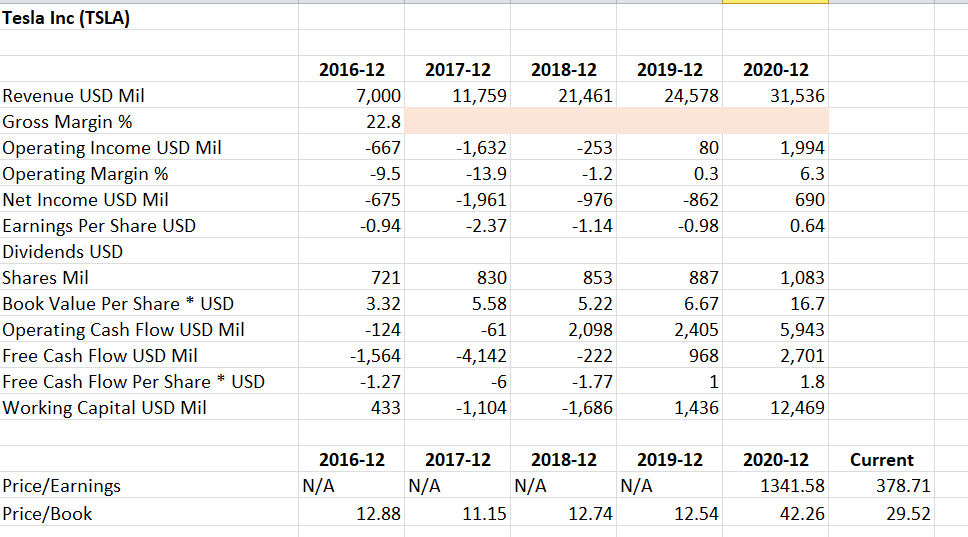
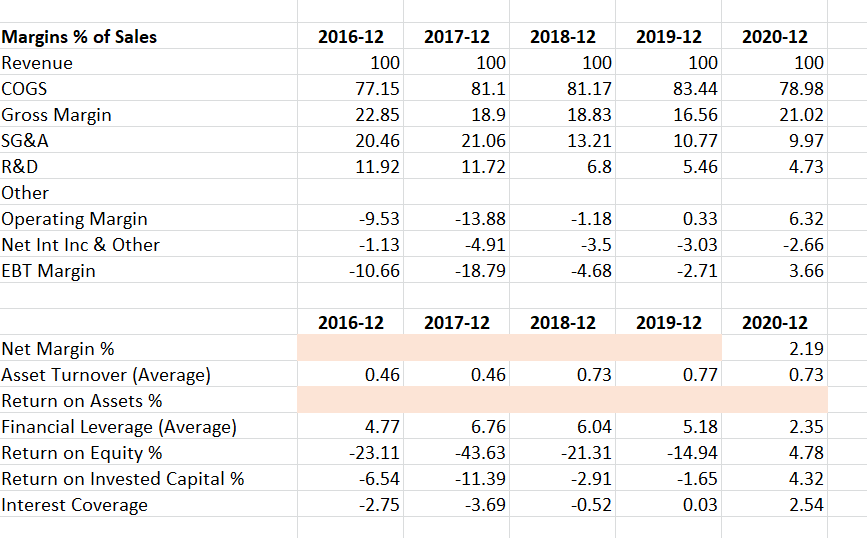
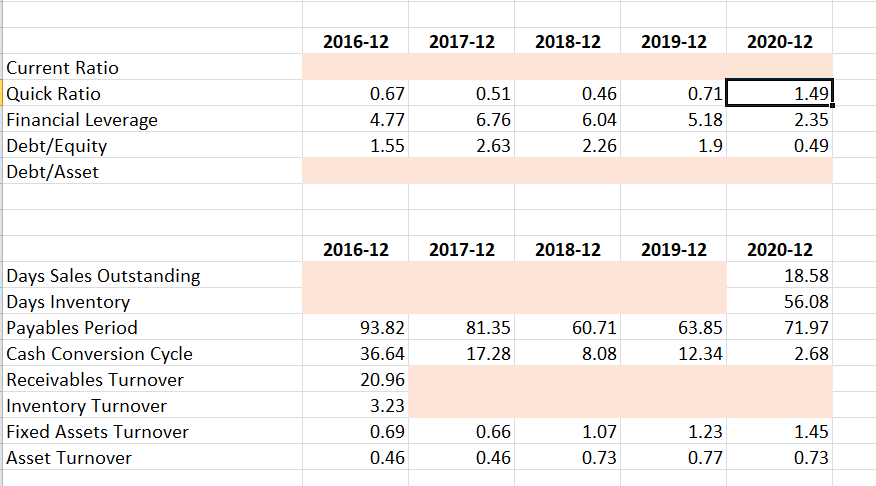


1/ Calculate ratios for the pink shaded areas. Prior ratios are given. Use formulas.
Using the ratios you calculated and other ratios provided in the file, analyze the profitability and efficiency of the company for the relevant years.
Tesla Inc (TSLA) 2017-12 11,759 2018-12 21,461 2019-12 24,578 2020-12 31,536 2016-12 7,000 22.8 -667 -9.5 -675 -0.94 -1,632 -13.9 -1,961 -2.37 -253 -1.2 -976 -1.14 80 0.3 -862 -0.98 1,994 6.3 690 0.64 Revenue USD Mil Gross Margin % Operating Income USD Mil Operating Margin % Net Income USD Mil Earnings Per Share USD Dividends USD Shares Mil Book Value Per Share * USD Operating Cash Flow USD Mil Free Cash Flow USD Mil Free Cash Flow Per Share * USD Working Capital USD Mil 721 3.32 -124 -1,564 -1.27 433 830 5.58 -61 -4,142 -6 -1,104 853 5.22 2,098 -222 -1.77 -1,686 887 6.67 2,405 968 1 1,436 1,083 16.7 5,943 2,701 1.8 12,469 Price/Earnings Price/Book 2016-12 2017-12 N/A N/A 12.88 11.15 2018-12 2019-12 N/A N/A 12.74 12.54 2020-12 1341.58 42.26 Current 378.71 29.52 Margins % of Sales Revenue COGS Gross Margin SG&A R&D Other Operating Margin Net Int Inc & Other EBT Margin 2016-12 100 77.15 22.85 20.46 11.92 2017-12 100 81.1 18.9 21.06 11.72 2018-12 100 81.17 18.83 13.21 6.8 2019-12 100 83.44 16.56 10.77 5.46 2020-12 100 78.98 21.02 9.97 4.73 -9.53 -1.13 -10.66 -13.88 -4.91 -18.79 -1.18 -3.5 -4.68 0.33 -3.03 -2.71 6.32 -2.66 3.66 2016-12 2017-12 2018-12 2019-12 2020-12 2.19 0.73 0.46 0.46 0.73 0.77 Net Margin % Asset Turnover (Average) Return on Assets % Financial Leverage (Average) Return on Equity % Return on Invested Capital % Interest Coverage 4.77 -23.11 -6.54 -2.75 6.76 -43.63 -11.39 -3.69 6.04 -21.31 -2.91 -0.52 5.18 -14.94 -1.65 0.03 2.35 4.78 4.32 2.54 2016-12 2017-12 2018-12 2019-12 2020-12 Current Ratio Quick Ratio Financial Leverage Debt/Equity Debt/Asset 0.67 4.77 1.55 0.51 6.76 2.63 0.46 6.04 2.26 0.71 5.18 1.9 1.49 2.35 0.49 2016-12 2017-12 2018-12 2019-12 2020-12 18.58 56.08 71.97 2.68 81.35 17.28 60.71 8.08 63.85 12.34 Days Sales Outstanding Days Inventory Payables Period Cash Conversion Cycle Receivables Turnover Inventory Turnover Fixed Assets Turnover Asset Turnover 93.82 36.64 20.96 3.23 0.69 0.46 0.66 0.46 1.07 0.73 1.23 0.77 1.45 0.73 2016-12 7000 5401 1599 2017-12 11759 9536 2222 2018-12 21461 17419 4042 2019-12 24578 20509 4069 2020-12 31536 24906 6630 834 1432 1378 2476 1491 3145 1343 2646 149 -149 3989 80 TESLA INC (TSLA) INCOME STATEMENT Fiscal year ends in December. USD in millions except per share data. Revenue Cost of revenue Gross profit Operating expenses Research and development Sales, General and administrative Restructuring, merger and acquisition Other operating expenses Total operating expenses Operating income Interest Expense Other income (expense) Income before taxes Provision for income taxes Net income from continuing operations Other Net income Net income available to common shareholders Earnings per share Basic Diluted Weighted average shares outstanding 2267 -667 199 120 -746 27 -773 98 -675 -675 685 1460 2834 135 -135 4295 -253 663 -89 -1005 58 -1063 86 3855 -1632 471 -106 -2209 32 -2241 279 -1961 -1961 -60 -665 110 -775 -87 -862 -862 4636 1994 748 -92 1154 292 862 -172 690 690 -976 -976 -0.94 -0.94 -2.37 -2.37 -1.14 -1.14 -0.98 -0.98 0.74 0.64 Basic Diluted EBITDA 721 721 400 2016-12 2017-12 2018-12 2019-12 2020-12 3368 6268 19384 3393 3393 499 3686 3686 949 3368 515 6268 19384 1886 1324 3113 TESLA INC (TSLA) BALANCE SHEET Fiscal year ends in December. USD in millions except per share data. Assets Current assets Cash Cash and cash equivalents Total cash Receivables Inventories Prepaid expenses Other current assets Total current assets Non-current assets Property, plant and equipment Gross property, plant and equipment Accumulated Depreciation Net property, plant and equipment Goodwill Intangible assets 2067 194 2264 268 155 4101 1346 366 3552 713 246 12103 106 193 6260 6571 8306 26717 16055 29447 -1018 22436 -1944 20492 60 22886 -3195 19691 31925 -11726 20199 198 339 -6072 23375 15037 68 207 376 362 282 Act 313 Windo 1470 1536 991 16404 22664 1171 22085 28655 1391 21433 29740 22206 25431 52148 34309 1150 897 2222 1758 52 67 489 1399 671 3771 611 660 6051 Other long-term assets Total non-current assets Total assets Liabilities and stockholders' equity Liabilities Current liabilities Short-term debt Capital leases Accounts payable Taxes payable Accrued liabilities Deferred revenues Other current liabilities Total current liabilities Non-current liabilities Long-term debt Capital leases Deferred taxes liabilities 2390 1860 153 3404 349 186 777 1005 1122 1534 2134 1257 1869 1427 1423 1889 2210 180 1008 983 792 658 5827 7675 9992 10667 14248 9418 10402 8513 5978 1408 8410 2706 1734 2225 2348 Acti151 Windo 150 276 547 745 989 1178 991 1207 1284 852 785 997 834 849 850 2911 1336 1596 1540 3140 16743 12084 17911 14824 24816 17024 27691 15675 29923 24418 Accrued liabilities Deferred revenues Minority interest Other long-term liabilities Total non-current liabilities Total liabilities Stockholders' equity Common stock Additional paid-in capital Retained earnings Accumulated other comprehensive income Total stockholders' equity Total liabilities and stockholders' equity 0 0 0 1 9178 10249 12737 27260 7774 -2997 -24 -4974 -5318 -6083 -36 -5399 363 33 -8 4753 4237 4923 6618 34309 22225 52148 22664 28655 29740Step by Step Solution
There are 3 Steps involved in it
Step: 1

Get Instant Access to Expert-Tailored Solutions
See step-by-step solutions with expert insights and AI powered tools for academic success
Step: 2

Step: 3
Ace Your Homework with AI
Get the answers you need in no time with our AI-driven, step-by-step assistance
Get Started
Financial Accounting
Authors: Paul D. Kimmel, Jerry J. Weygandt, Donald E. Kieso
3rd Edition
0471372668, 978-0471372660