

Question
1. Calculate the 10 ratios done in Exhibit 4 for each year from 2008 to 2010. Do you notice any trends? What insights do these
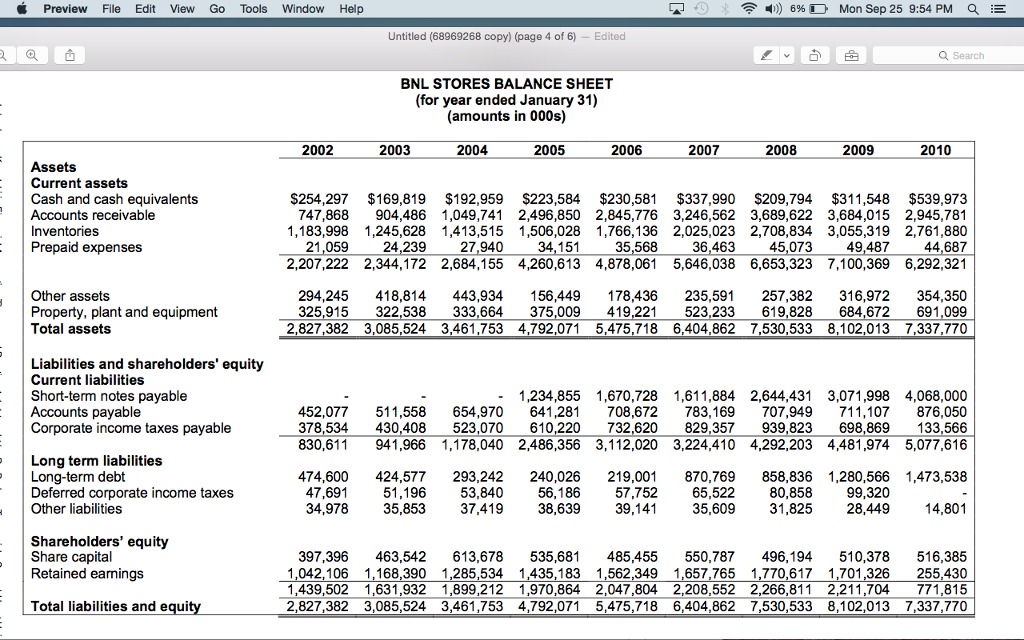
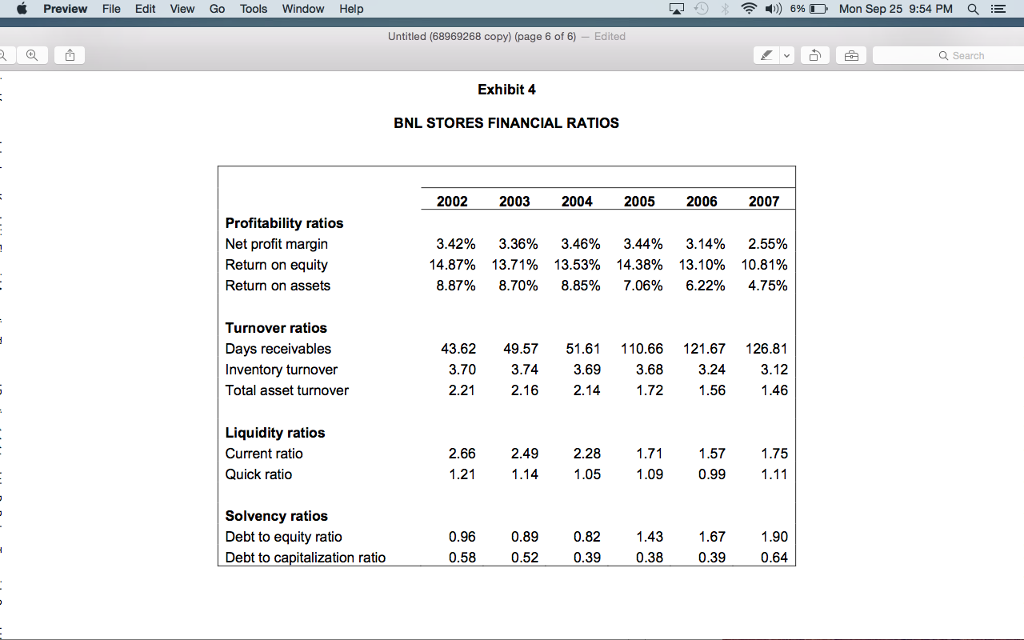
1. Calculate the 10 ratios done in Exhibit 4 for each year from 2008 to 2010. Do you notice any trends? What insights do these trends provide into the operations of BNL?
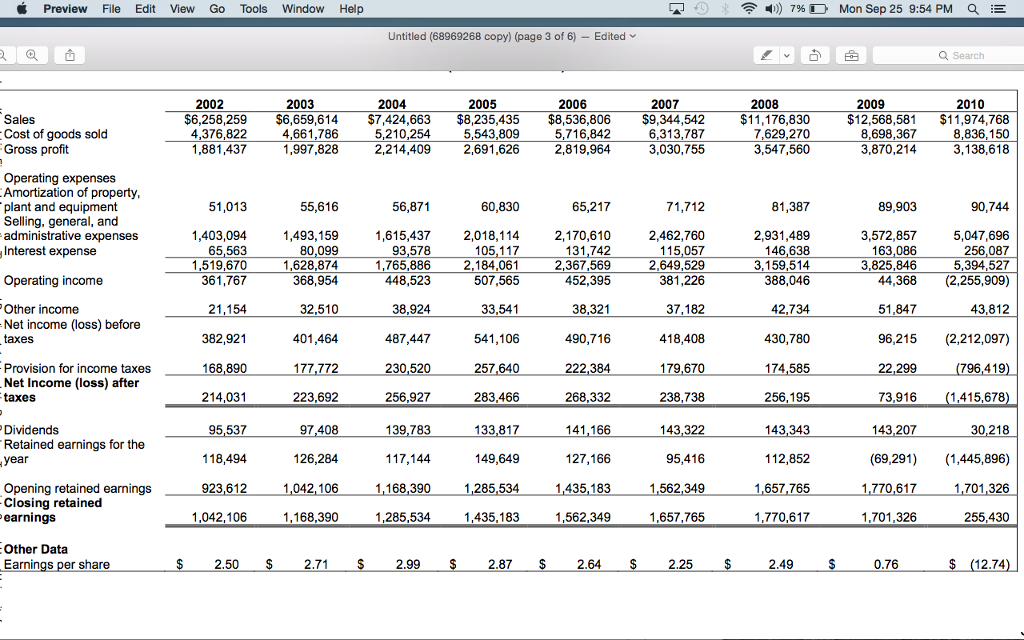
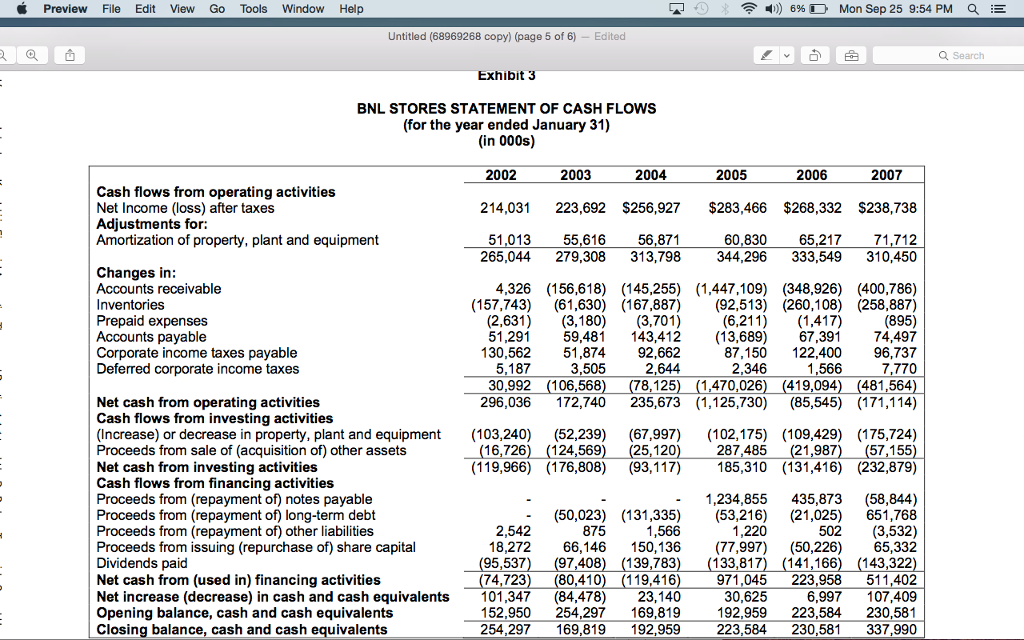
2. Following the format given in Exhibit 3, prepare statements of cash flows for BNL for each year from 2008 to 2010. Please use the following figures for the additions to property, plant and equipment:
(Increase) or decrease in property, plant and equipment 2008 (177,982) 2009 (154,747) 2010 (97,171)
3. What do the cash flow statements show? What does this mean for the future viability of the firm? How helpful is this analysis in understanding the companys stock price performance?
Preview File Edit View Go Tools Window Help 4)) 7% D Mon Sep 25 9:54 PM Untitled (68969268 co py/page 3 of 6)-Edited Search 2002 2003 2005 2006 2009 2010 $12,568,581 $11,974,768 $6,258,259 $6,659,614 7,424,663 $8,235,435 $8,536,806 $9,344,542 $11,176,830 7,629,270 3,547,560 6,313,787 3,030,755 5,543,809 Cost of goods sold Gross profit 4,376,822 1,881,437 4,661,786 1,997,828 5,210,254 2,214,409 2,691,626 5,716,842 2,819,964 8,698,367 3,870,214 8,836,150 3,138,618 Operating expenses Amortization of property 51,013 55,616 56,871 65,217 81,387 89,903 Selling, general, and administrative expenses Interest expense 1,403,094 65,563 1,519,670 361,767 1,493,159 80,099 1,628,874 368,954 2,462,760 115,057 2,649,529 3,572,857 163,086 3,825,846 2,931,489 146,638 93,578 1,765,886 448,523 1,615,437 2,018,114 2,170,610 105,117 2,367,569 452,395 5,047,696 256,087 5,394,527 44,368(2,255,909) 2,184,061 Operating income 507,565 388,046 er 32,510 38,924 51,847 Net income (loss) before taxes 382,921 168,890 214,031 418,408 179,670 238,738 143,322 430,780 96,215 (2,212,097) 177,772 223,692 97,408 490,716 222,384 268,332 230,520 256,927 139,783 117,144 1,168,390 1,285,534 257,640 22,299 Provision for income taxes Net Income (loss) after taxes 283,466 Dividends Retained earnings for the year 1,415,678 30,218 (69,291)(1,445,896) 143,207 127,166 1,435,183 1,562,349 112,852 1,657,765 1,770,617 923,612 1,042,106 Opening retained earnings Closing retained earnings 1,285,534 1,770,617 1,168,390 1,435,183 1,657,765 1,701,326 255,430 Other Data
Step by Step Solution
There are 3 Steps involved in it
Step: 1

Get Instant Access to Expert-Tailored Solutions
See step-by-step solutions with expert insights and AI powered tools for academic success
Step: 2

Step: 3
Ace Your Homework with AI
Get the answers you need in no time with our AI-driven, step-by-step assistance
Get Started
Say What Communicate With Tact And Impact What To Say To Get Results At Any Point In An Audit
Authors: Ann M. Butera
1st Edition
1032057734, 978-1032057736