

Question
1) Calculate the Companys WACC (to nearest decimal place), operating NOPLAT, free cash flow for year ( t+2) and the continuing value for the Company
1) Calculate the Companys WACC (to nearest decimal place), operating NOPLAT, free cash flow for year (t+2) and the continuing value for the Company as at the end of year (t+2) (i.e. the NPV of cash flows beyond year t+2). 2) Perform a DCF valuation of the Company. Calculate the resulting enterprise value of operations at the end of year t. 3) What is the percentage difference between the Companys DCF valuation of the shares and the share price? Propose three different potential reasons for why your estimated share price is different from the current trading price. 4) Calculate the Companys invested capital in operations and ROIC for year t+2. (4 points)
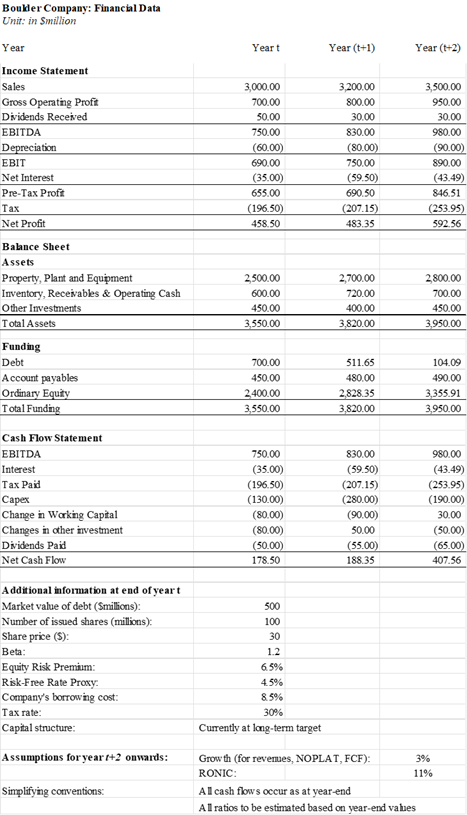
Boulder Company: Financial Data Unit: in Smillion Year Income Statement Sales Gross Operating Profit Dividends Received EBITDA Depreciation EBIT Net Interest Pre-Tax Profit Tax Net Profit Balance Sheet Assets Property, Plant and Equipment Inventory, Receivables & Operating Cash Other Investments Total Assets Funding Debt Account payables Ordinary Equity Total Funding Cash Flow Statement EBITDA Interest Tax Paid Capex Change in Working Capital Changes in other investment Dividends Paid Net Cash Flow Additional information at end of yeart Market value of debt (Smillions): Number of issued shares (millions): Share price ($): Beta: Equity Risk Premium: Risk-Free Rate Proxy: Company's borrowing cost: Tax rate: Capital structure: Assumptions for year +2 onwards: Simplifying conventions: Yeart 3,000.00 700.00 50.00 750.00 (60.00) 690.00 (35.00) 655.00 (196.50) 458.50 2,500.00 600.00 450.00 3,550.00 700.00 450.00 2,400.00 3,550.00 750.00 (35.00) (196.50) (130.00) (80.00) (80.00) (50.00) 178.50 500 100 30 1.2 6.5% 4.5% 8.5% 30% Currently at long-term target 3% Growth (for revenues, NOPLAT, FCF): RONIC: 11% All cash flows occur as at year-end All ratios to be estimated based on year-end values Year (t+1) 3,200.00 800.00 30.00 830.00 (80.00) 750.00 (59.50) 690.50 (207.15) 483.35 2,700.00 720.00 400.00 3,820.00 511.65 480.00 2,828.35 3,820.00 830.00 (59.50) (207.15) (280.00) (90.00) 50.00 (55.00) 188.35 Year (+2) 3,500.00 950.00 30.00 980.00 (90.00) 890.00 (43.49) 846.51 (253.95) 592.56 2,800.00 700.00 450.00 3,950.00 104.09 490.00 3,355.91 3,950.00 980.00 (43.49) (253.95) (190.00) 30.00 (50.00) (65.00) 407.56 Boulder Company: Financial Data Unit: in Smillion Year Income Statement Sales Gross Operating Profit Dividends Received EBITDA Depreciation EBIT Net Interest Pre-Tax Profit Tax Net Profit Balance Sheet Assets Property, Plant and Equipment Inventory, Receivables & Operating Cash Other Investments Total Assets Funding Debt Account payables Ordinary Equity Total Funding Cash Flow Statement EBITDA Interest Tax Paid Capex Change in Working Capital Changes in other investment Dividends Paid Net Cash Flow Additional information at end of yeart Market value of debt (Smillions): Number of issued shares (millions): Share price ($): Beta: Equity Risk Premium: Risk-Free Rate Proxy: Company's borrowing cost: Tax rate: Capital structure: Assumptions for year +2 onwards: Simplifying conventions: Yeart 3,000.00 700.00 50.00 750.00 (60.00) 690.00 (35.00) 655.00 (196.50) 458.50 2,500.00 600.00 450.00 3,550.00 700.00 450.00 2,400.00 3,550.00 750.00 (35.00) (196.50) (130.00) (80.00) (80.00) (50.00) 178.50 500 100 30 1.2 6.5% 4.5% 8.5% 30% Currently at long-term target 3% Growth (for revenues, NOPLAT, FCF): RONIC: 11% All cash flows occur as at year-end All ratios to be estimated based on year-end values Year (t+1) 3,200.00 800.00 30.00 830.00 (80.00) 750.00 (59.50) 690.50 (207.15) 483.35 2,700.00 720.00 400.00 3,820.00 511.65 480.00 2,828.35 3,820.00 830.00 (59.50) (207.15) (280.00) (90.00) 50.00 (55.00) 188.35 Year (+2) 3,500.00 950.00 30.00 980.00 (90.00) 890.00 (43.49) 846.51 (253.95) 592.56 2,800.00 700.00 450.00 3,950.00 104.09 490.00 3,355.91 3,950.00 980.00 (43.49) (253.95) (190.00) 30.00 (50.00) (65.00) 407.56Step by Step Solution
There are 3 Steps involved in it
Step: 1

Get Instant Access to Expert-Tailored Solutions
See step-by-step solutions with expert insights and AI powered tools for academic success
Step: 2

Step: 3
Ace Your Homework with AI
Get the answers you need in no time with our AI-driven, step-by-step assistance
Get Started
Chains Of Finance How Investment Management Is Shaped
Authors: Diane-Laure Arjalies, Philip Grant, Iain Hardie, Donald MacKenzie, Ekaterina Svetlova
1st Edition
0198802943, 978-0198802945