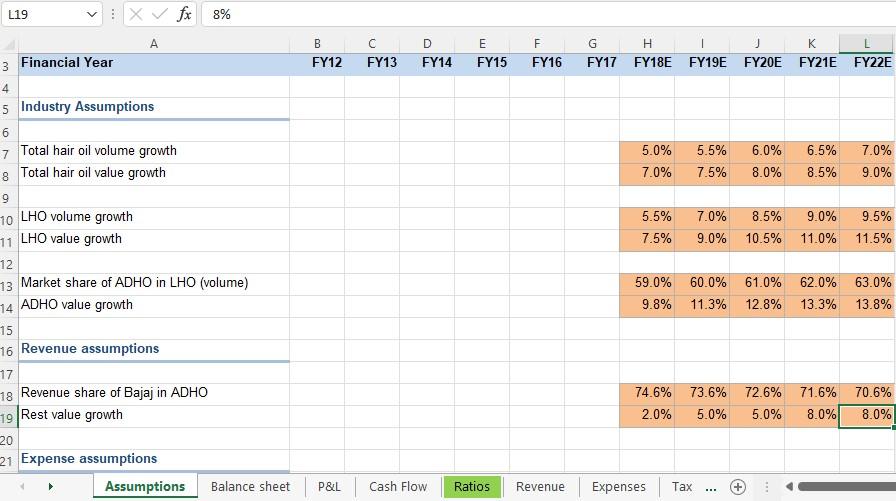
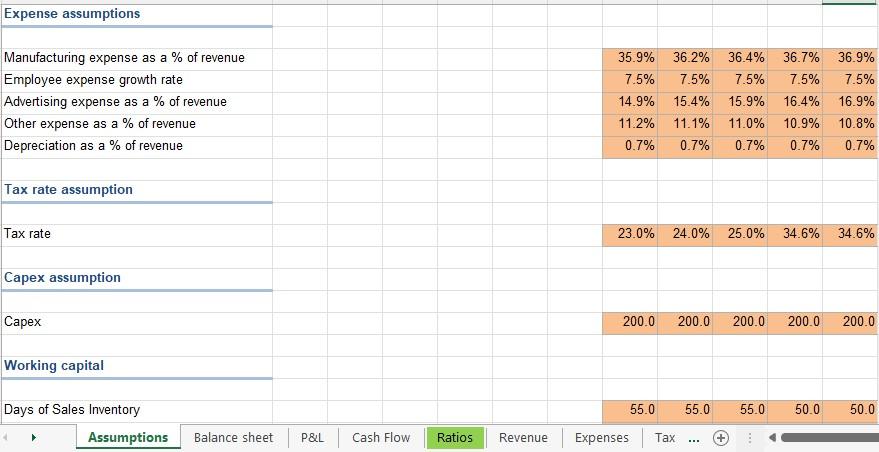
1. . Calculate the cost of equity, debt, and WACC. Please use the assumptions tab for inputs for these calculations
Assumptions
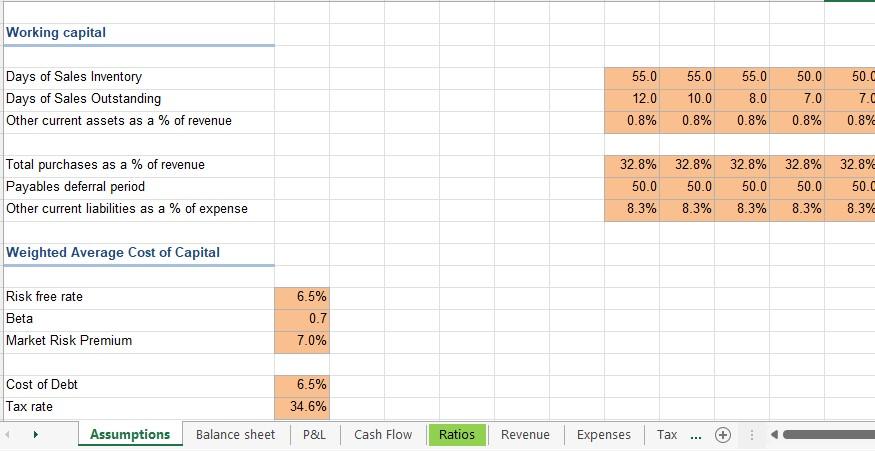
WACC
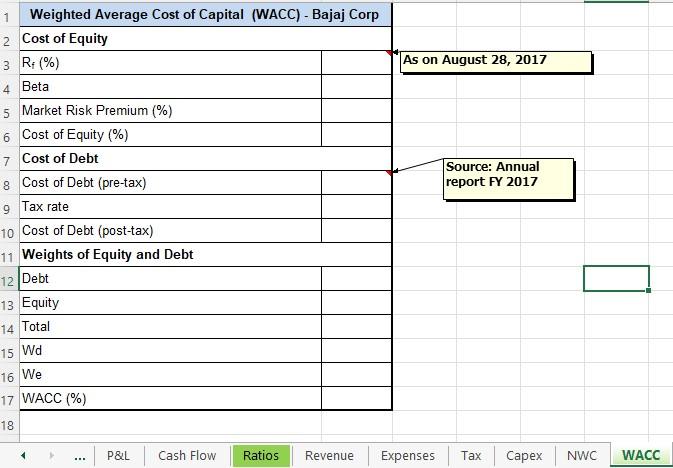
L19 EX fx 8% A B FY12 FY13 E FY15 F FY16 FY14 G H K FY17 FY18E FY19E FY20E FY21E FY22E 7.0% 5.0% 7.0% 5.5% 7.5% 6.0% 8.0% 6.5% 8.5% 9.0% 5.5% 7.5% 7.0% 9.0% 8.5% 10.5% 9.0% 11.0% 9.5% 11.5% 3 Financial Year 4 5 Industry Assumptions 6 7 Total hair oil volume growth 8 Total hair oil value growth 9 10 LHO volume growth 11 LHO value growth 12 13 Market share of ADHO in LHO (volume) 14 ADHO value growth 15 16 Revenue assumptions 17 18 Revenue share of Bajaj in ADHO 19 Rest value growth 20 21 Expense assumptions Assumptions Balance sheet 59.0% 60.0% 9.8% 11.3% 61.0% 12.8% 62.0% 13.3% 63.0% 13.8% 74.6% 2.0% 73.6% 5.0% 72.6% 5.0% 71.6% 8.0% 70.6% 8.0% P&L Cash Flow Ratios Revenue Expenses Tax ... Expense assumptions 36.7% Manufacturing expense as a % of revenue Employee expense growth rate Advertising expense as a % of revenue Other expense as a % of revenue Depreciation as a % of revenue 35.9% 7.5% 14.9% 11.2% 0.7% 36.2% 7.5% 15.4% 11.1% 0.7% 36.4% 7.5% 15.9% 11.0% 0.7% 7.5% 16.4% 10.9% 0.7% 36.9% 7.5% 16.9% 10.8% 0.7% Tax rate assumption Tax rate 23.0% 24.0% 25.0% 34.6% 34.6% Capex assumption Capex 200.0 200.0 200.0 200.0 200.0 Working capital 55.0 55.0 55.0 50.0 50.0 Days of Sales Inventory Assumptions Balance sheet P&L Cash Flow Ratios Revenue Expenses Tax + HIE Working capital Days of Sales Inventory Days of Sales Outstanding Other current assets as a % of revenue 55.0 12.0 0.8% 55.0 10.0 0.8% 55.0 8.0 0.8% 50.0 7.0 0.8% 50.C 7.C 0.8% Total purchases as a % of revenue Payables deferral period Other current liabilities as a % of expense 32.8% 50.0 8.3% 32.8% 50.0 8.3% 32.8% 50.0 8.3% 32.8% 50.0 8.3% 32.8% 50.C 8.3% Weighted Average Cost of Capital Risk free rate Beta Market Risk Premium 6.5% 0.7 7.0% Cost of Debt Tax rate Assumptions 6.5% 34.6% Balance sheet P&L Cash Flow Ratios Revenue Expenses Tax + HE 1 Weighted Average Cost of Capital (WACC) - Bajaj Corp 2 Cost of Equity 3 R:(%) As on August 28, 2017 4 Beta 5 Market Risk Premium (%) 6 Cost of Equity (%) 7 Cost of Debt 8 Cost of Debt (pre-tax) 9 Tax rate 10 Cost of Debt (post-tax) 11 Weights of Equity and Debt Source: Annual report FY 2017 12 Debt 13 Equity 14 Total 15 Wd 16 We 17 WACC (%) 18 ... P&L Cash Flow Ratios Revenue Expenses Tax Capex NWC WACC L19 EX fx 8% A B FY12 FY13 E FY15 F FY16 FY14 G H K FY17 FY18E FY19E FY20E FY21E FY22E 7.0% 5.0% 7.0% 5.5% 7.5% 6.0% 8.0% 6.5% 8.5% 9.0% 5.5% 7.5% 7.0% 9.0% 8.5% 10.5% 9.0% 11.0% 9.5% 11.5% 3 Financial Year 4 5 Industry Assumptions 6 7 Total hair oil volume growth 8 Total hair oil value growth 9 10 LHO volume growth 11 LHO value growth 12 13 Market share of ADHO in LHO (volume) 14 ADHO value growth 15 16 Revenue assumptions 17 18 Revenue share of Bajaj in ADHO 19 Rest value growth 20 21 Expense assumptions Assumptions Balance sheet 59.0% 60.0% 9.8% 11.3% 61.0% 12.8% 62.0% 13.3% 63.0% 13.8% 74.6% 2.0% 73.6% 5.0% 72.6% 5.0% 71.6% 8.0% 70.6% 8.0% P&L Cash Flow Ratios Revenue Expenses Tax ... Expense assumptions 36.7% Manufacturing expense as a % of revenue Employee expense growth rate Advertising expense as a % of revenue Other expense as a % of revenue Depreciation as a % of revenue 35.9% 7.5% 14.9% 11.2% 0.7% 36.2% 7.5% 15.4% 11.1% 0.7% 36.4% 7.5% 15.9% 11.0% 0.7% 7.5% 16.4% 10.9% 0.7% 36.9% 7.5% 16.9% 10.8% 0.7% Tax rate assumption Tax rate 23.0% 24.0% 25.0% 34.6% 34.6% Capex assumption Capex 200.0 200.0 200.0 200.0 200.0 Working capital 55.0 55.0 55.0 50.0 50.0 Days of Sales Inventory Assumptions Balance sheet P&L Cash Flow Ratios Revenue Expenses Tax + HIE Working capital Days of Sales Inventory Days of Sales Outstanding Other current assets as a % of revenue 55.0 12.0 0.8% 55.0 10.0 0.8% 55.0 8.0 0.8% 50.0 7.0 0.8% 50.C 7.C 0.8% Total purchases as a % of revenue Payables deferral period Other current liabilities as a % of expense 32.8% 50.0 8.3% 32.8% 50.0 8.3% 32.8% 50.0 8.3% 32.8% 50.0 8.3% 32.8% 50.C 8.3% Weighted Average Cost of Capital Risk free rate Beta Market Risk Premium 6.5% 0.7 7.0% Cost of Debt Tax rate Assumptions 6.5% 34.6% Balance sheet P&L Cash Flow Ratios Revenue Expenses Tax + HE 1 Weighted Average Cost of Capital (WACC) - Bajaj Corp 2 Cost of Equity 3 R:(%) As on August 28, 2017 4 Beta 5 Market Risk Premium (%) 6 Cost of Equity (%) 7 Cost of Debt 8 Cost of Debt (pre-tax) 9 Tax rate 10 Cost of Debt (post-tax) 11 Weights of Equity and Debt Source: Annual report FY 2017 12 Debt 13 Equity 14 Total 15 Wd 16 We 17 WACC (%) 18 ... P&L Cash Flow Ratios Revenue Expenses Tax Capex NWC WACC