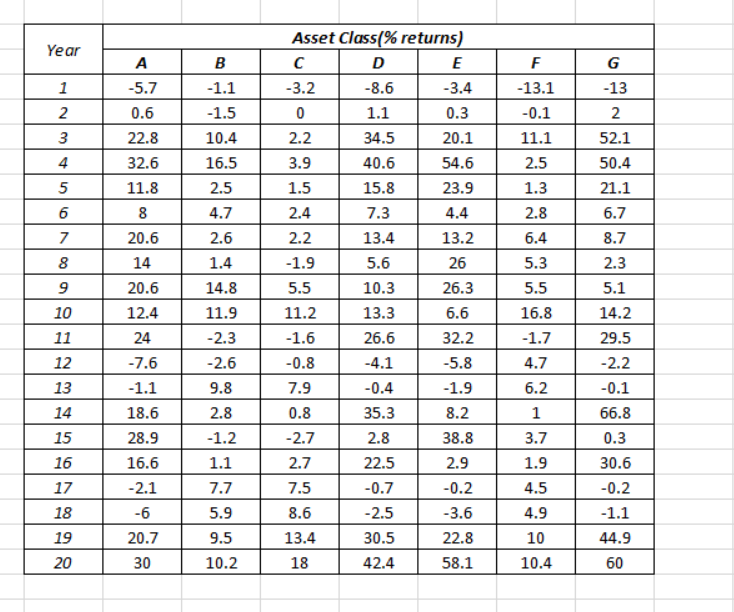
1. Calculate the expected return (sample arithmetic mean) and sample standard deviation of returns of each asset class. Also calculate the sample geometric mean average historical rate of return for each asset class. Comment on the relationship between arithmetic mean and geometric mean returns. (15%) diversification across this set of assets. (10%) multiplied covariance matrix, based on an equally weighted risky-asset portfolio. (10%) 5%, 6%, 7%, 8%, 9%, 10%, 11% 12% 13% 14% 15% 16% 17% and 18%. Graph them. (1096) maximises the investor's utility. (596) return of 4%, 5%, 6%, 7%, 8%, 9%, 10%, 11%,12%, 13% 14% 15% 15% 17% and 18%. Graph them. (10%) maxim ises the investor's utility. (5%) 2. Calculate the correlation matrix of returns. Comment on the correlation matrix, with reference to the potential for risk reducing benefits from 3. Using the approach recommended in the instruction video on the course website, construct (i) a covariance matrix for the asset classes;(ii) a border 4. Construct a restricted minimum variance frontier and a restricted efficient frontier for these asset classes, using target expected rates of return of 4% 5. Assuming a coefficient of risk aversion of 5 and assuming the investor is not able to borrow, identify which of the above target rates of return 6. Construct an unrestricted minimum variance frontier and an unrestricted efficient frontier for these asset classes, using target expected rates of 7. Assuming a coefficient of risk aversion of 5 and assuming the investor is not able to borrow, identify which of the above target rates of return 8. Explain the reasons for any difference between the utility-maximising target expected rate of return in questions 5 and 7.5%) 9. Now assume it is possible for the investor to borrow funds at a rate of interest of 1.5% per annum, which is also the rate of interest on the risk-free asset, but it is not permitted to short-sell risky assets. Draw a capital allocation line onto the diagram. Show that it is now possible to obtain the same target expected rate of return you identified in question 5, but at lower risk. What combined portfolio should be selected if the aim is to maximise investor utility, based on the restricted frontier and the capital allocation line? (15%) 10. What assumptions have you made when undertaking the above analysis? Suppose that economic conditions have changed, so that expected returns on risky assets are lower than during the sample period, risks are higher and correlations are higher. What would this imply? In what sense is fundamental uncertainty of relevance to investment analysts and those who offer investment advice? (15%) Asset Class(% returns Year 5.7 0.6 22.8 32.6 11.8 -13.1 1.1 8.6 -13 52.1 50.4 21.1 6.7 8.7 2.3 5.1 14.2 29.5 10.4 34.5 40.6 15.8 7.3 13.4 5.6 10.3 13.3 26.6 20.1 54.6 23.9 4.4 13.2 26 26.3 6.6 32.2 11.1 2.5 16.5 1.5 2.4 5 4.7 2.8 6.4 20.6 14 20.6 12.4 24 7.6 1.1 18.6 28.9 16.6 2.1 2.6 1.9 5.5 11.2 8 5.5 16.8 1.7 4.7 6.2 1 3.7 14.8 11.9 2.3 10 12 13 14 15 16 17 18 19 20 0.4 35.3 2.8 22.5 0.7 7.9 1.9 8.2 38.8 2.9 0.2 3.6 22.8 58.1 2.8 1.2 66.8 -2.7 2.7 7.5 30.6 7.7 4.5 1.1 44.9 60 20.7 30 13.4 30.5 10 10.2 18 42.4 10.4 1. Calculate the expected return (sample arithmetic mean) and sample standard deviation of returns of each asset class. Also calculate the sample geometric mean average historical rate of return for each asset class. Comment on the relationship between arithmetic mean and geometric mean returns. (15%) diversification across this set of assets. (10%) multiplied covariance matrix, based on an equally weighted risky-asset portfolio. (10%) 5%, 6%, 7%, 8%, 9%, 10%, 11% 12% 13% 14% 15% 16% 17% and 18%. Graph them. (1096) maximises the investor's utility. (596) return of 4%, 5%, 6%, 7%, 8%, 9%, 10%, 11%,12%, 13% 14% 15% 15% 17% and 18%. Graph them. (10%) maxim ises the investor's utility. (5%) 2. Calculate the correlation matrix of returns. Comment on the correlation matrix, with reference to the potential for risk reducing benefits from 3. Using the approach recommended in the instruction video on the course website, construct (i) a covariance matrix for the asset classes;(ii) a border 4. Construct a restricted minimum variance frontier and a restricted efficient frontier for these asset classes, using target expected rates of return of 4% 5. Assuming a coefficient of risk aversion of 5 and assuming the investor is not able to borrow, identify which of the above target rates of return 6. Construct an unrestricted minimum variance frontier and an unrestricted efficient frontier for these asset classes, using target expected rates of 7. Assuming a coefficient of risk aversion of 5 and assuming the investor is not able to borrow, identify which of the above target rates of return 8. Explain the reasons for any difference between the utility-maximising target expected rate of return in questions 5 and 7.5%) 9. Now assume it is possible for the investor to borrow funds at a rate of interest of 1.5% per annum, which is also the rate of interest on the risk-free asset, but it is not permitted to short-sell risky assets. Draw a capital allocation line onto the diagram. Show that it is now possible to obtain the same target expected rate of return you identified in question 5, but at lower risk. What combined portfolio should be selected if the aim is to maximise investor utility, based on the restricted frontier and the capital allocation line? (15%) 10. What assumptions have you made when undertaking the above analysis? Suppose that economic conditions have changed, so that expected returns on risky assets are lower than during the sample period, risks are higher and correlations are higher. What would this imply? In what sense is fundamental uncertainty of relevance to investment analysts and those who offer investment advice? (15%) Asset Class(% returns Year 5.7 0.6 22.8 32.6 11.8 -13.1 1.1 8.6 -13 52.1 50.4 21.1 6.7 8.7 2.3 5.1 14.2 29.5 10.4 34.5 40.6 15.8 7.3 13.4 5.6 10.3 13.3 26.6 20.1 54.6 23.9 4.4 13.2 26 26.3 6.6 32.2 11.1 2.5 16.5 1.5 2.4 5 4.7 2.8 6.4 20.6 14 20.6 12.4 24 7.6 1.1 18.6 28.9 16.6 2.1 2.6 1.9 5.5 11.2 8 5.5 16.8 1.7 4.7 6.2 1 3.7 14.8 11.9 2.3 10 12 13 14 15 16 17 18 19 20 0.4 35.3 2.8 22.5 0.7 7.9 1.9 8.2 38.8 2.9 0.2 3.6 22.8 58.1 2.8 1.2 66.8 -2.7 2.7 7.5 30.6 7.7 4.5 1.1 44.9 60 20.7 30 13.4 30.5 10 10.2 18 42.4 10.4