

Question
1. Calculate the following ratios for the past 3 years: Inventory turnover, Receivables turnover, Payables turnover. A. Provide a financial forecast for 2015. The forecast
1. Calculate the following ratios for the past 3 years: Inventory turnover, Receivables turnover, Payables turnover.
A. Provide a financial forecast for 2015. The forecast should be based on the information provided in the case. You should build your forecast from ratios by tying variables to sales or, when appropriate, the cost of goods sold (COGS). Use AP days, AR days, etc., to forecast 2015 AP, AR, etc.
Once you have forecasted every item based on the given expectations for 2015, you should estimate the additional financing needed to fund Blue Ridge and include it as part of the line of credit.
2. How do changes in your assumptions change the projected line of credit account? Show different analyses.
3A. For the year ending 2013 and 2014, construct a statement of cash flows.
3B. For the years ending 2013 and 2014, calculate the free cash flow generated by Blue Ridge
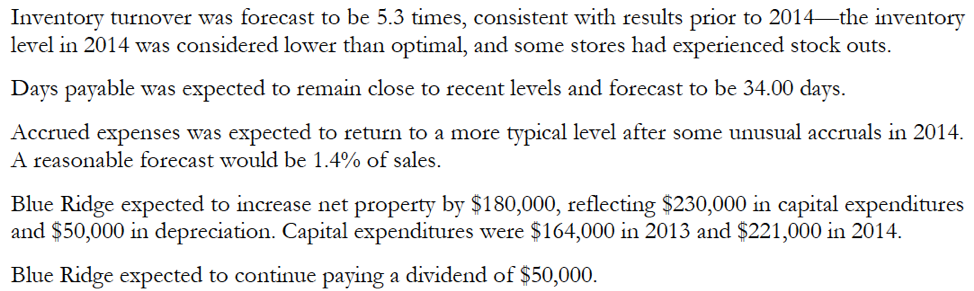
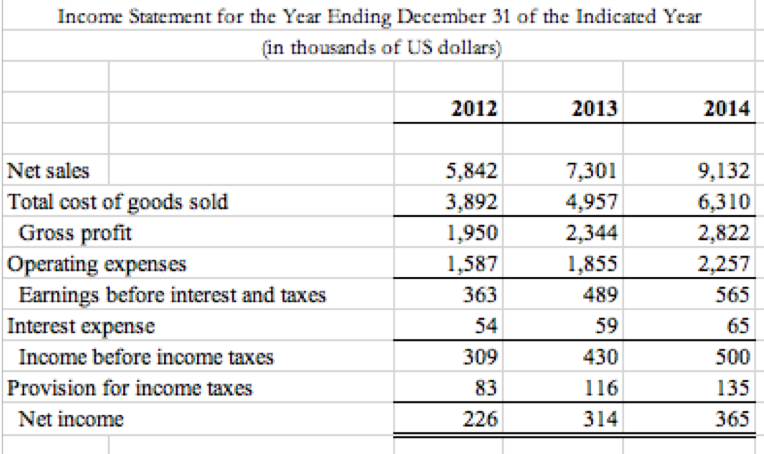
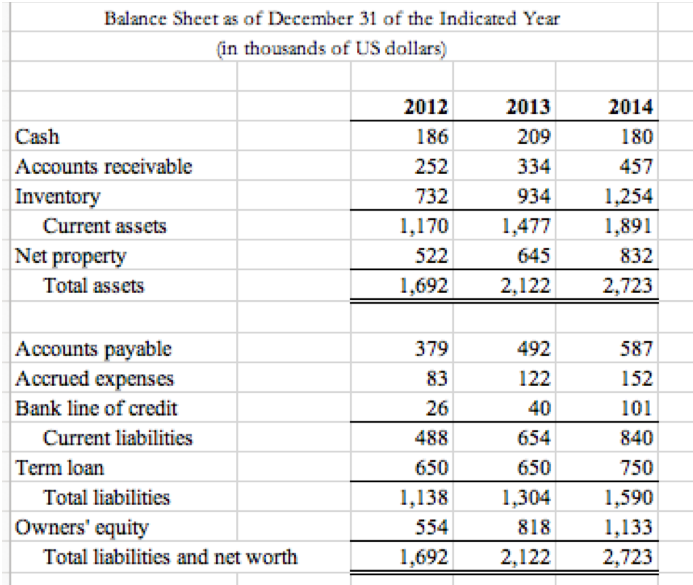
Inventory turnover was forecast to be 5.3 times, consistent with results prior to 2014the inventory level in 2014 was considered lower than optimal, and some stores had experienced stock outs. Days payable was expected to remain close to recent levels and forecast to be 34.00 days. Accrued expenses was expected to return to a more typical level after some unusual accruals in 2014. A reasonable forecast would be 1.4% of sales. Blue Ridge expected to increase net property by $180,000, reflecting $230,000 in capital expenditures and $50,000 in depreciation. Capital expenditures were $164,000 in 2013 and $221,000 in 2014. Blue Ridge expected to continue paying a dividend of $50,000. Income Statement for the Year Ending December 31 of the Indicated Year (in thousands of US dollars) 2012 2013 2014 Net sales Total cost of goods sold Gross profit Operating expenses Earnings before interest and taxes Interest expense Income before income taxes Provision for income taxes Net income 5,842 3,892 1,950 1,587 363 54 309 83 226 7,301 4,957 2,344 1,855 489 59 430 116 314 9,132 6,310 2,822 2,257 565 65 500 135 365 Balance Sheet as of December 31 of the Indicated Year (in thousands of US dollars) Cash Accounts receivable Inventory Current assets Net property Total assets 2012 186 252 732 1,170 522 1,692 2013 209 334 934 1,477 645 2,122 2014 180 457 1,254 1.891 832 2,723 492 122 40 654 Accounts payable Accrued expenses Bank line of credit Current liabilities Term loan Total liabilities Owners' equity Total liabilities and net worth 379 83 26 488 650 1,138 554 1,692 587 152 101 840 750 1,590 1,133 2,723 650 1,304 818 2,122 Inventory turnover was forecast to be 5.3 times, consistent with results prior to 2014the inventory level in 2014 was considered lower than optimal, and some stores had experienced stock outs. Days payable was expected to remain close to recent levels and forecast to be 34.00 days. Accrued expenses was expected to return to a more typical level after some unusual accruals in 2014. A reasonable forecast would be 1.4% of sales. Blue Ridge expected to increase net property by $180,000, reflecting $230,000 in capital expenditures and $50,000 in depreciation. Capital expenditures were $164,000 in 2013 and $221,000 in 2014. Blue Ridge expected to continue paying a dividend of $50,000. Income Statement for the Year Ending December 31 of the Indicated Year (in thousands of US dollars) 2012 2013 2014 Net sales Total cost of goods sold Gross profit Operating expenses Earnings before interest and taxes Interest expense Income before income taxes Provision for income taxes Net income 5,842 3,892 1,950 1,587 363 54 309 83 226 7,301 4,957 2,344 1,855 489 59 430 116 314 9,132 6,310 2,822 2,257 565 65 500 135 365 Balance Sheet as of December 31 of the Indicated Year (in thousands of US dollars) Cash Accounts receivable Inventory Current assets Net property Total assets 2012 186 252 732 1,170 522 1,692 2013 209 334 934 1,477 645 2,122 2014 180 457 1,254 1.891 832 2,723 492 122 40 654 Accounts payable Accrued expenses Bank line of credit Current liabilities Term loan Total liabilities Owners' equity Total liabilities and net worth 379 83 26 488 650 1,138 554 1,692 587 152 101 840 750 1,590 1,133 2,723 650 1,304 818 2,122Step by Step Solution
There are 3 Steps involved in it
Step: 1

Get Instant Access to Expert-Tailored Solutions
See step-by-step solutions with expert insights and AI powered tools for academic success
Step: 2

Step: 3
Ace Your Homework with AI
Get the answers you need in no time with our AI-driven, step-by-step assistance
Get Started
Accounting Principles
Authors: Jerry Weygandt, Paul Kimmel, Donald Kieso
11th Edition
111856667X, 978-1118566671